 The survey began at the invitation of Gianfranco Ghiara at the University of Calabria which had just opened in 1974. The Italian government had given the school generous funding to support its new research programs, however the laboratories were still under construction meaning research would have to be done in the open air. Seeking for suitable projects, Ghiara found Albert Ammerman, a young archaeologist at Stanford who had recently begun a survey in the Parma Valley of northern Italy. The offer accepted, Ammerman, his colleagues, and Ghiara developed a plan to work in several different areas of Calabria, focusing on the region’s prehistory.
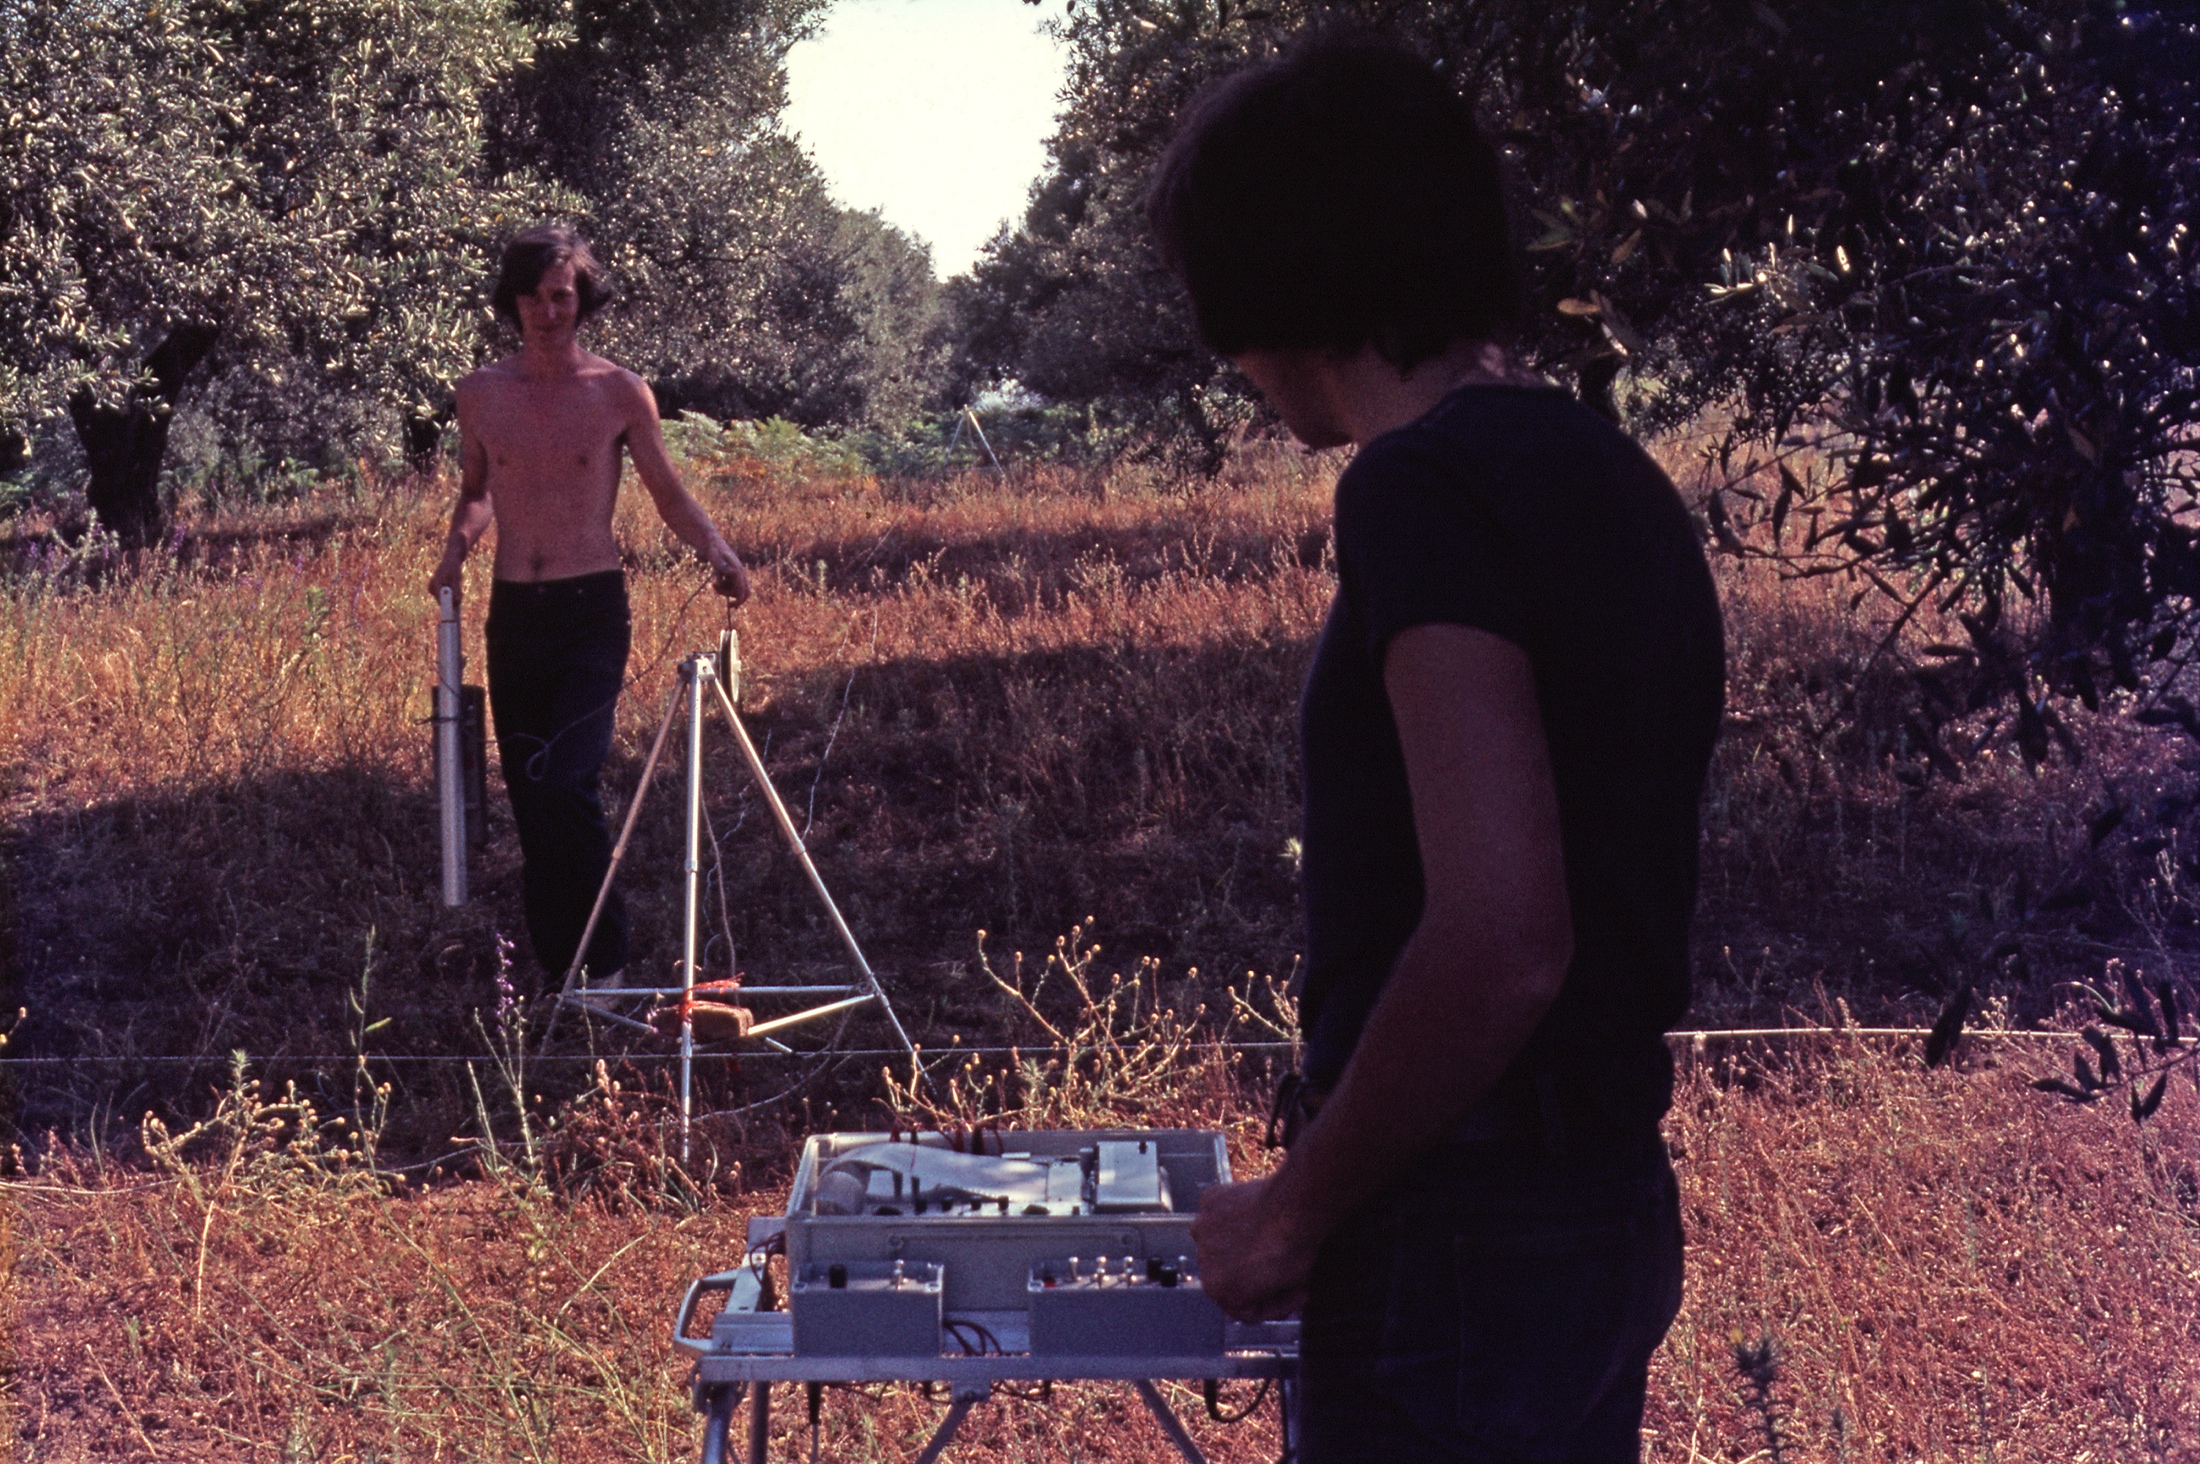
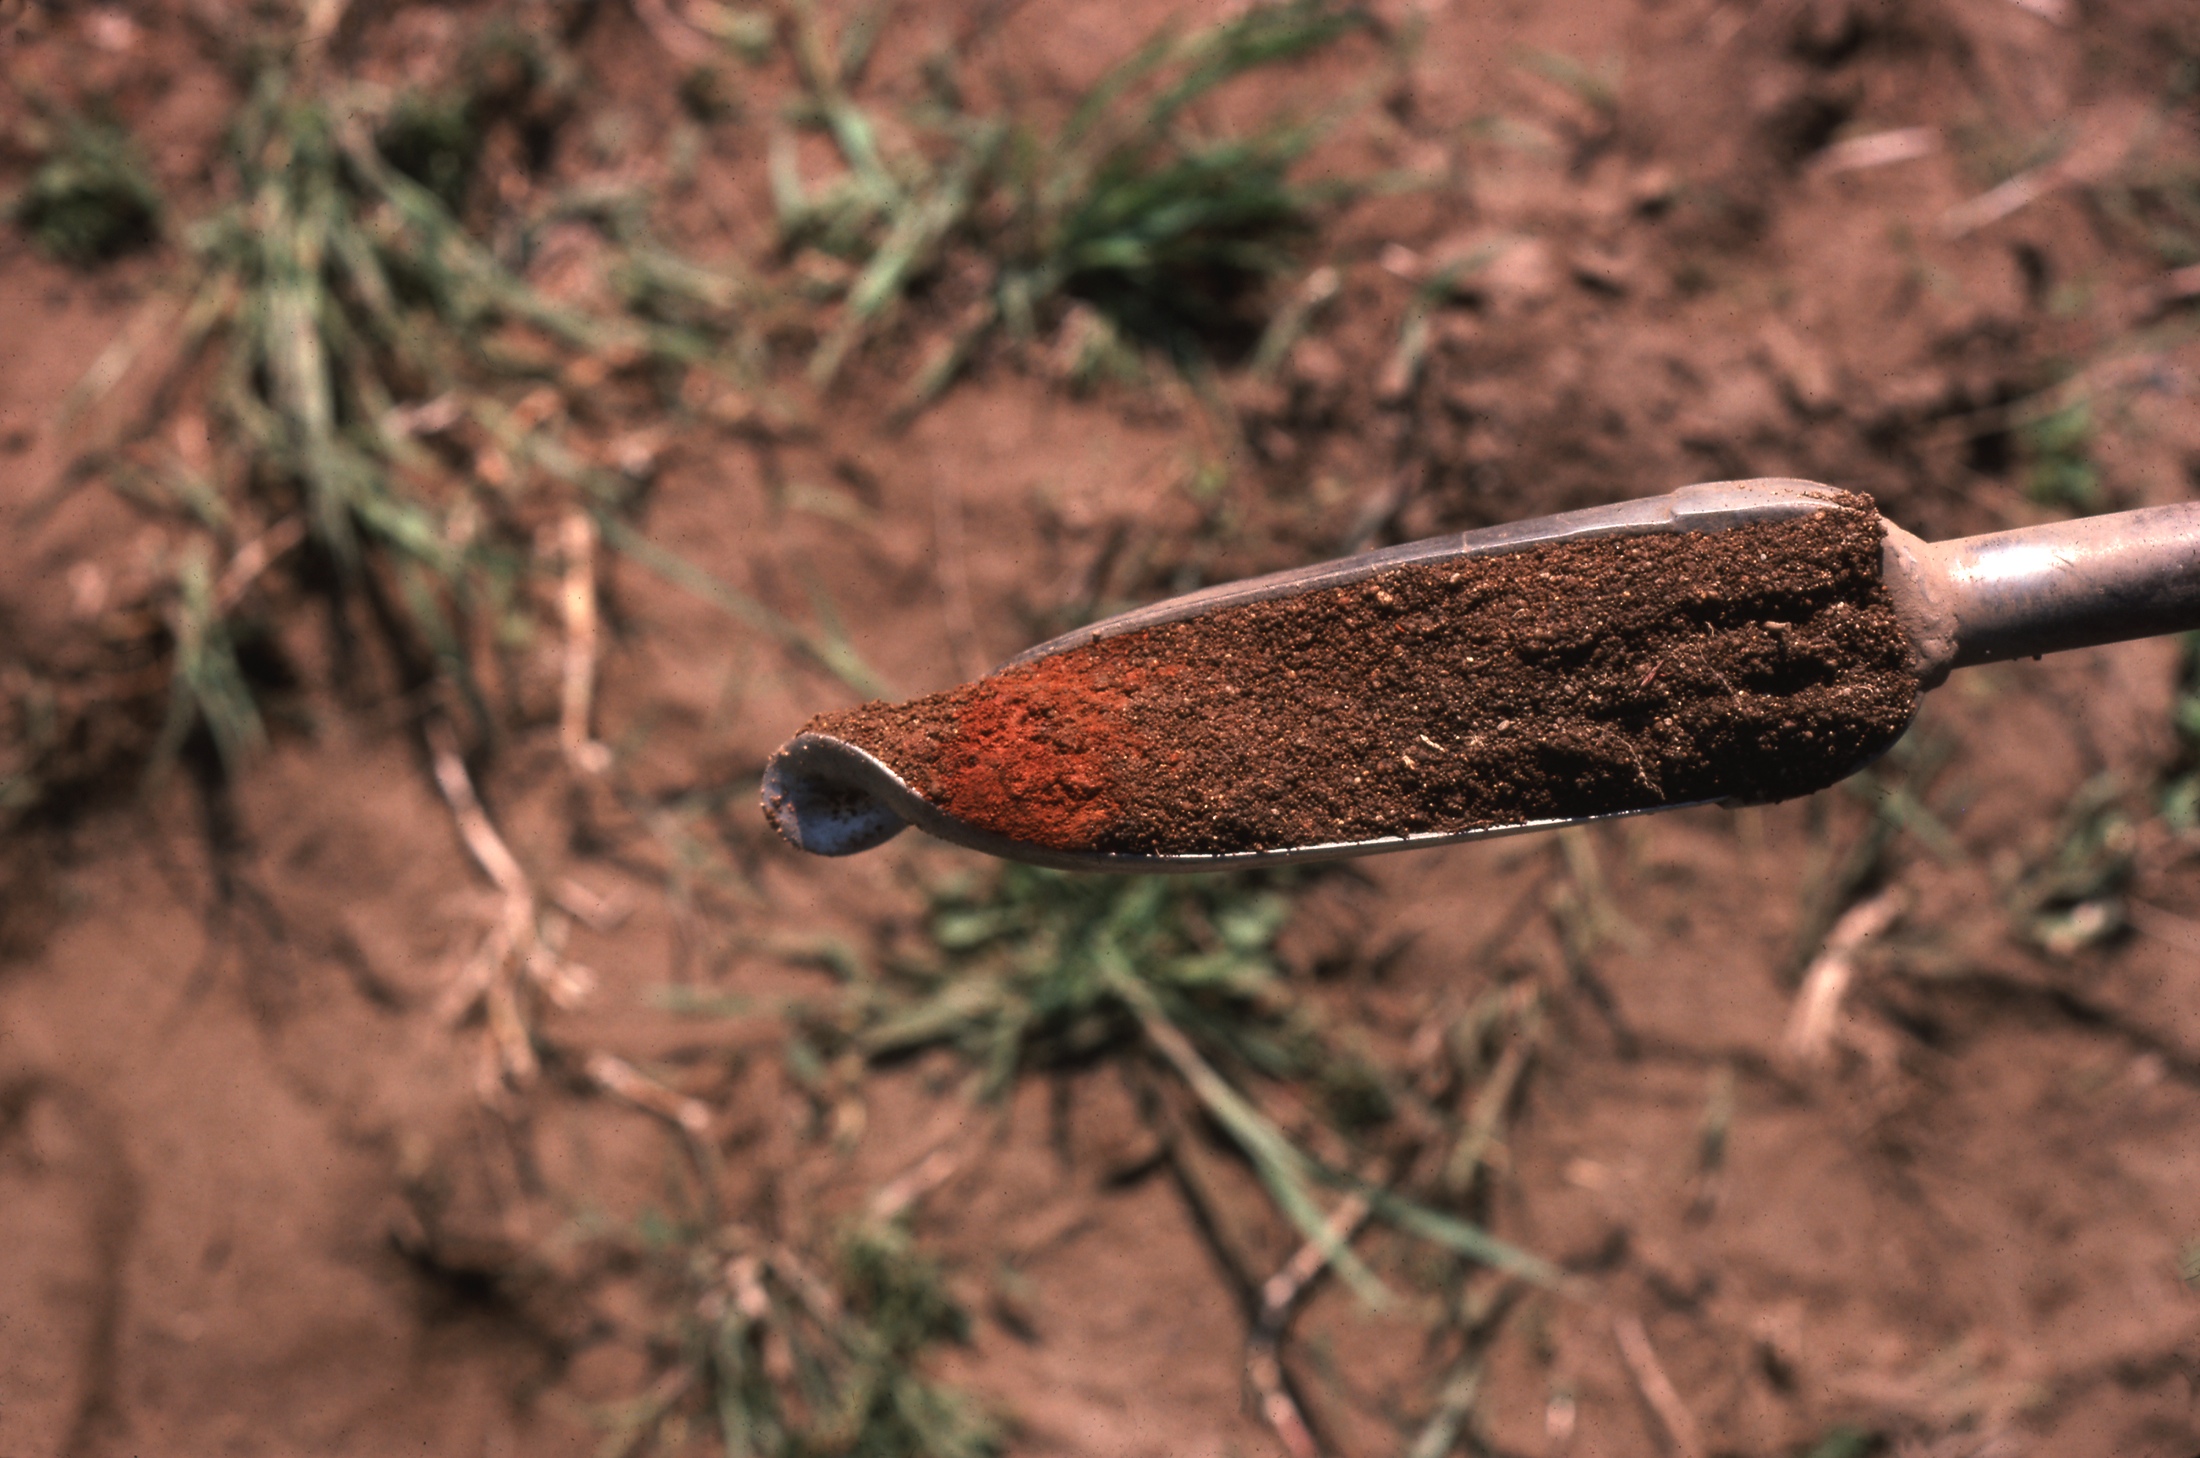 At the time, very little was known about the prehistory of Calabria and it had been suggested that the Neolithic era might have skipped over it altogether. To test that statement, the initial survey set out to cover four areas with different environmental settings and compare any patterns of Neolithic settlement. The four areas included Acconia, and also Amantea, Nicotera, and Le Castella, with Acconia the most promising. At these sites, the team put to the test new survey techniques developed at Stanford by covering the area using a combination of magnetometers (pictured above) and coring (pictured left) to locate fried clay buried in the soil. The result was the discovery of 24 prehistoric sites (as mapped below.)
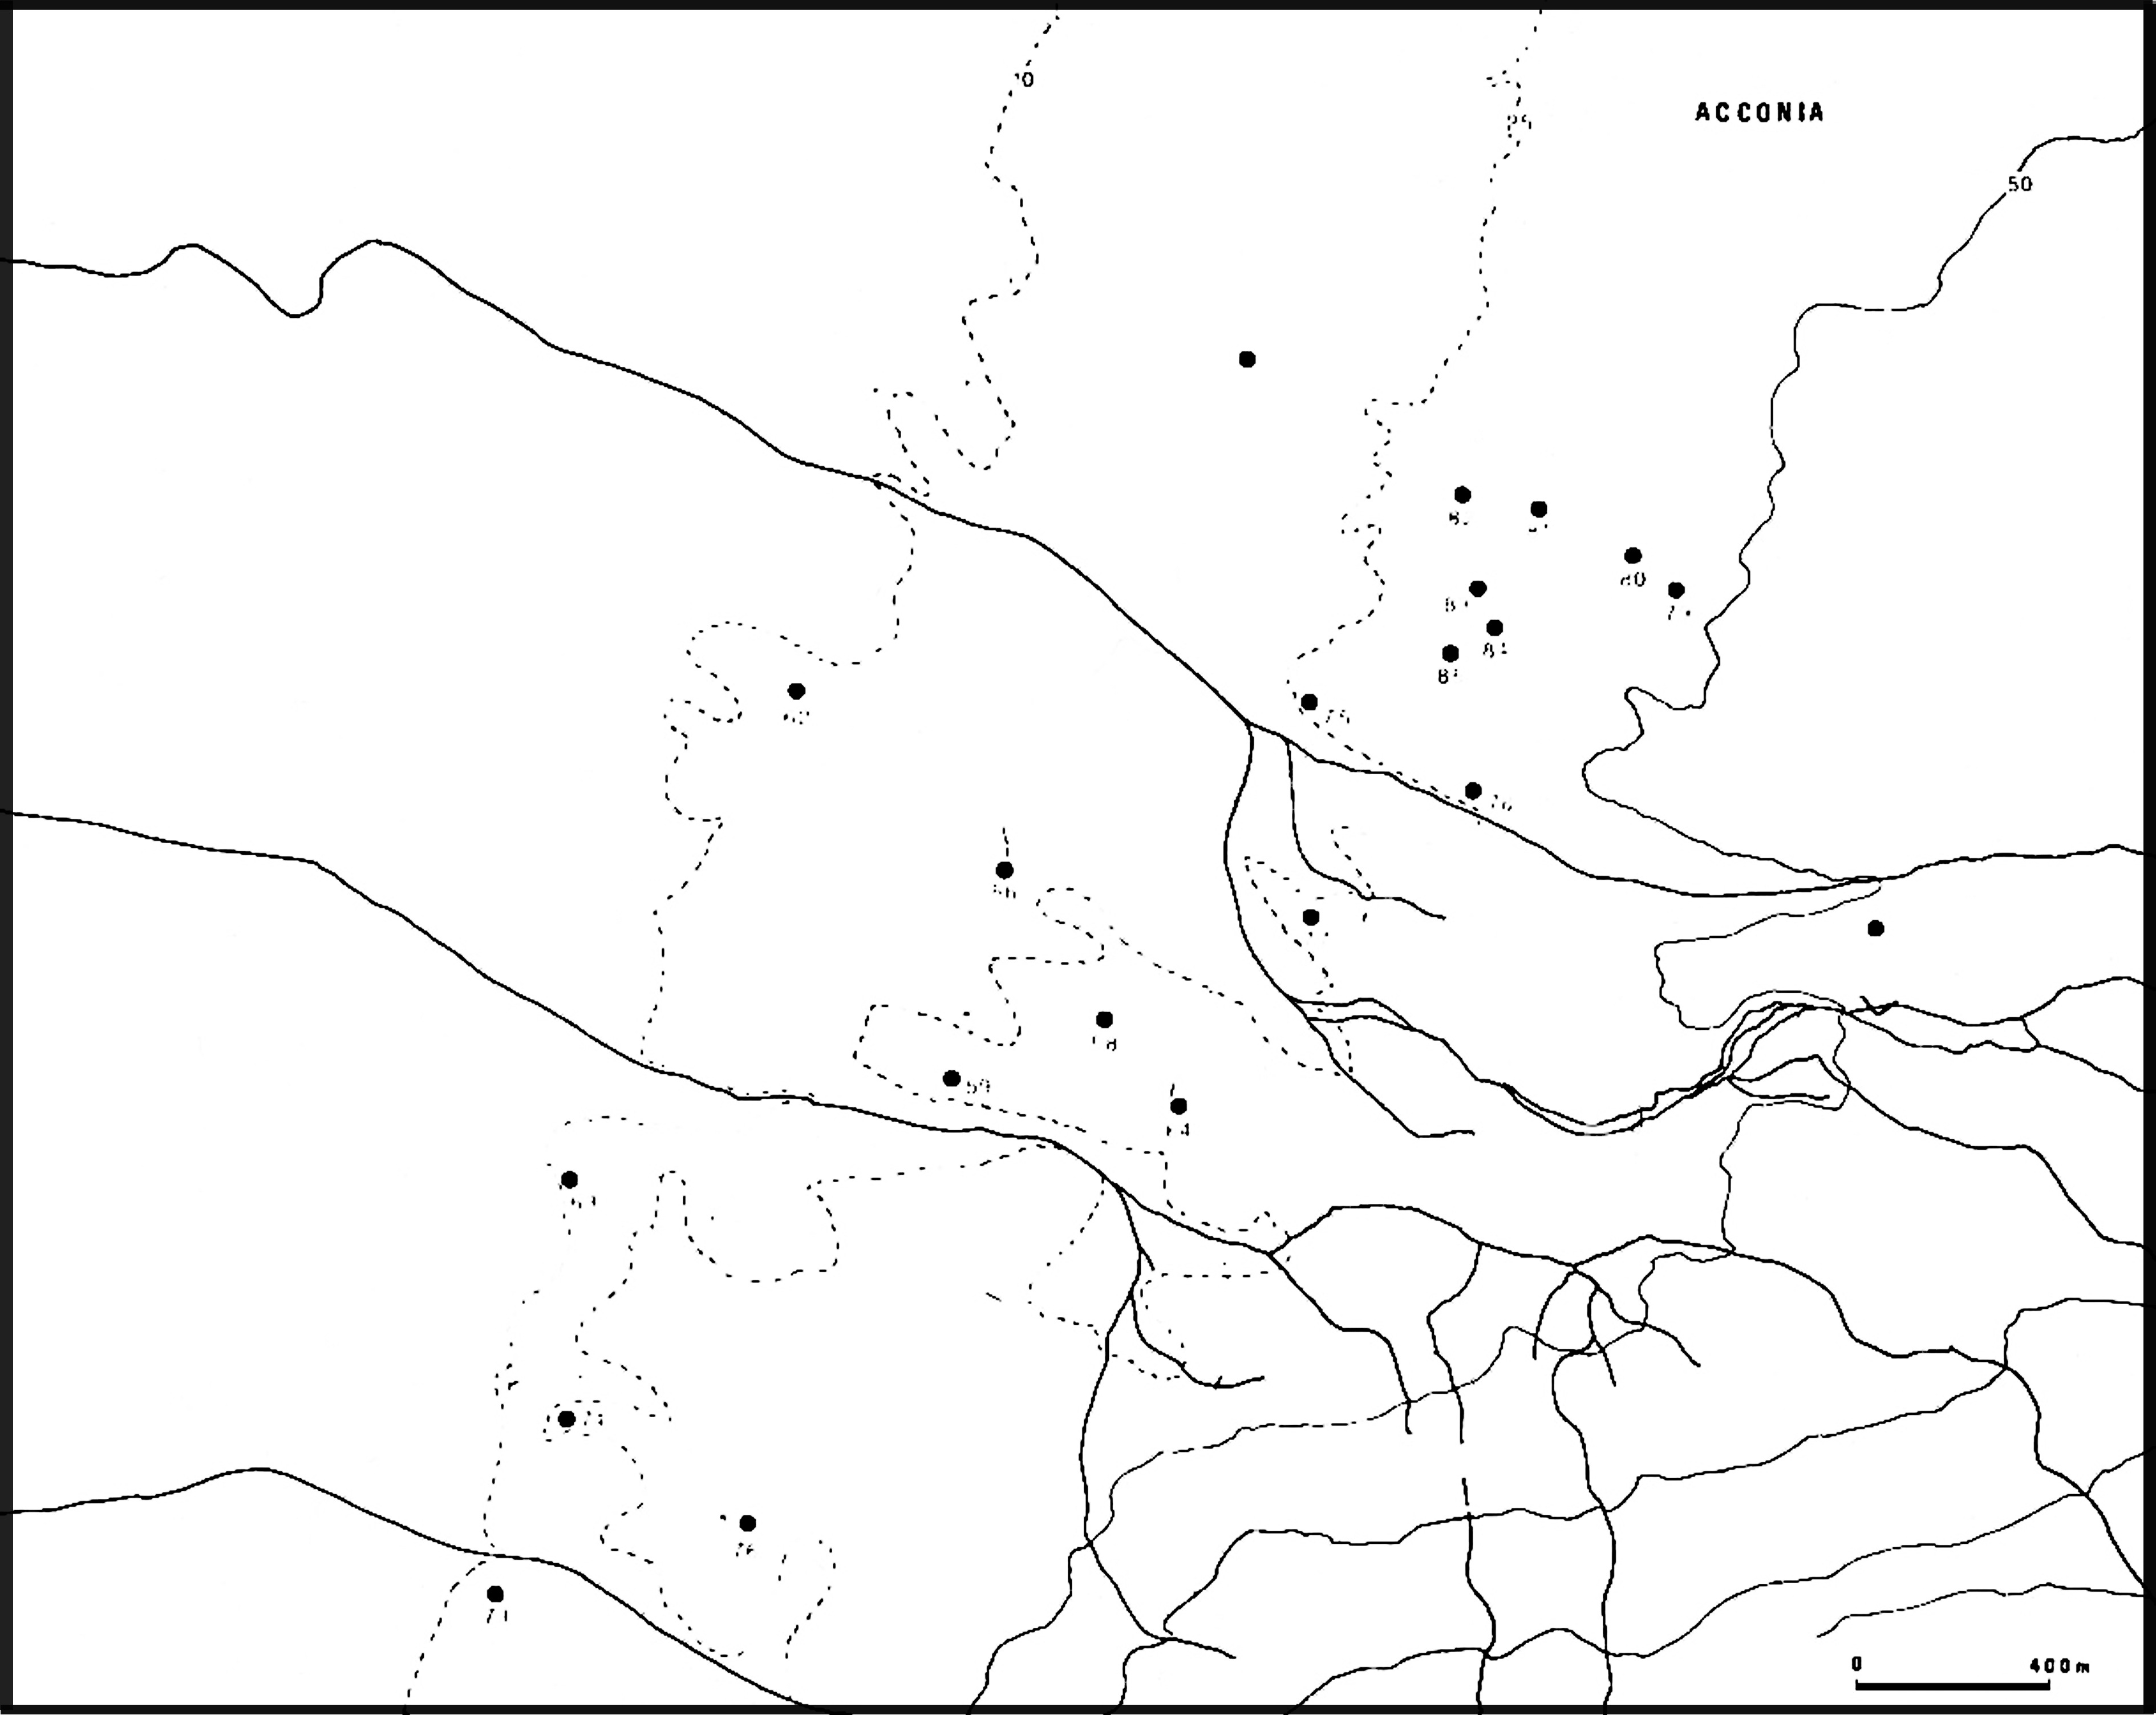
Map of the prehistoric sites found during the first trip to Acconia. (lecture by A.J. Ammerman)
 After they returned to Stanford and delivered the impressive results, a new question arose. Marcus Feldman (pictured right) from the Department of Biological Sciences asked what would happen if the coverage were repeated a second time and whether or not the results would change. The methodology of survey archaeology in 1974 did not include repeating coverage, despite repeated field trials already being standard practice in ecology, Feldman’s area, by that time. Taking up the challenge yielded tremendous results. On the return in Spring 1975, scatters of prehistoric material could now be seen in places where nothing had been visible on the surface in the first season and by the end of the fourth field season in 1976, a total of 75 sites had been found (mapped below.) More would continue to be discovered in the course of activity there, but they were no longer the sole focus.
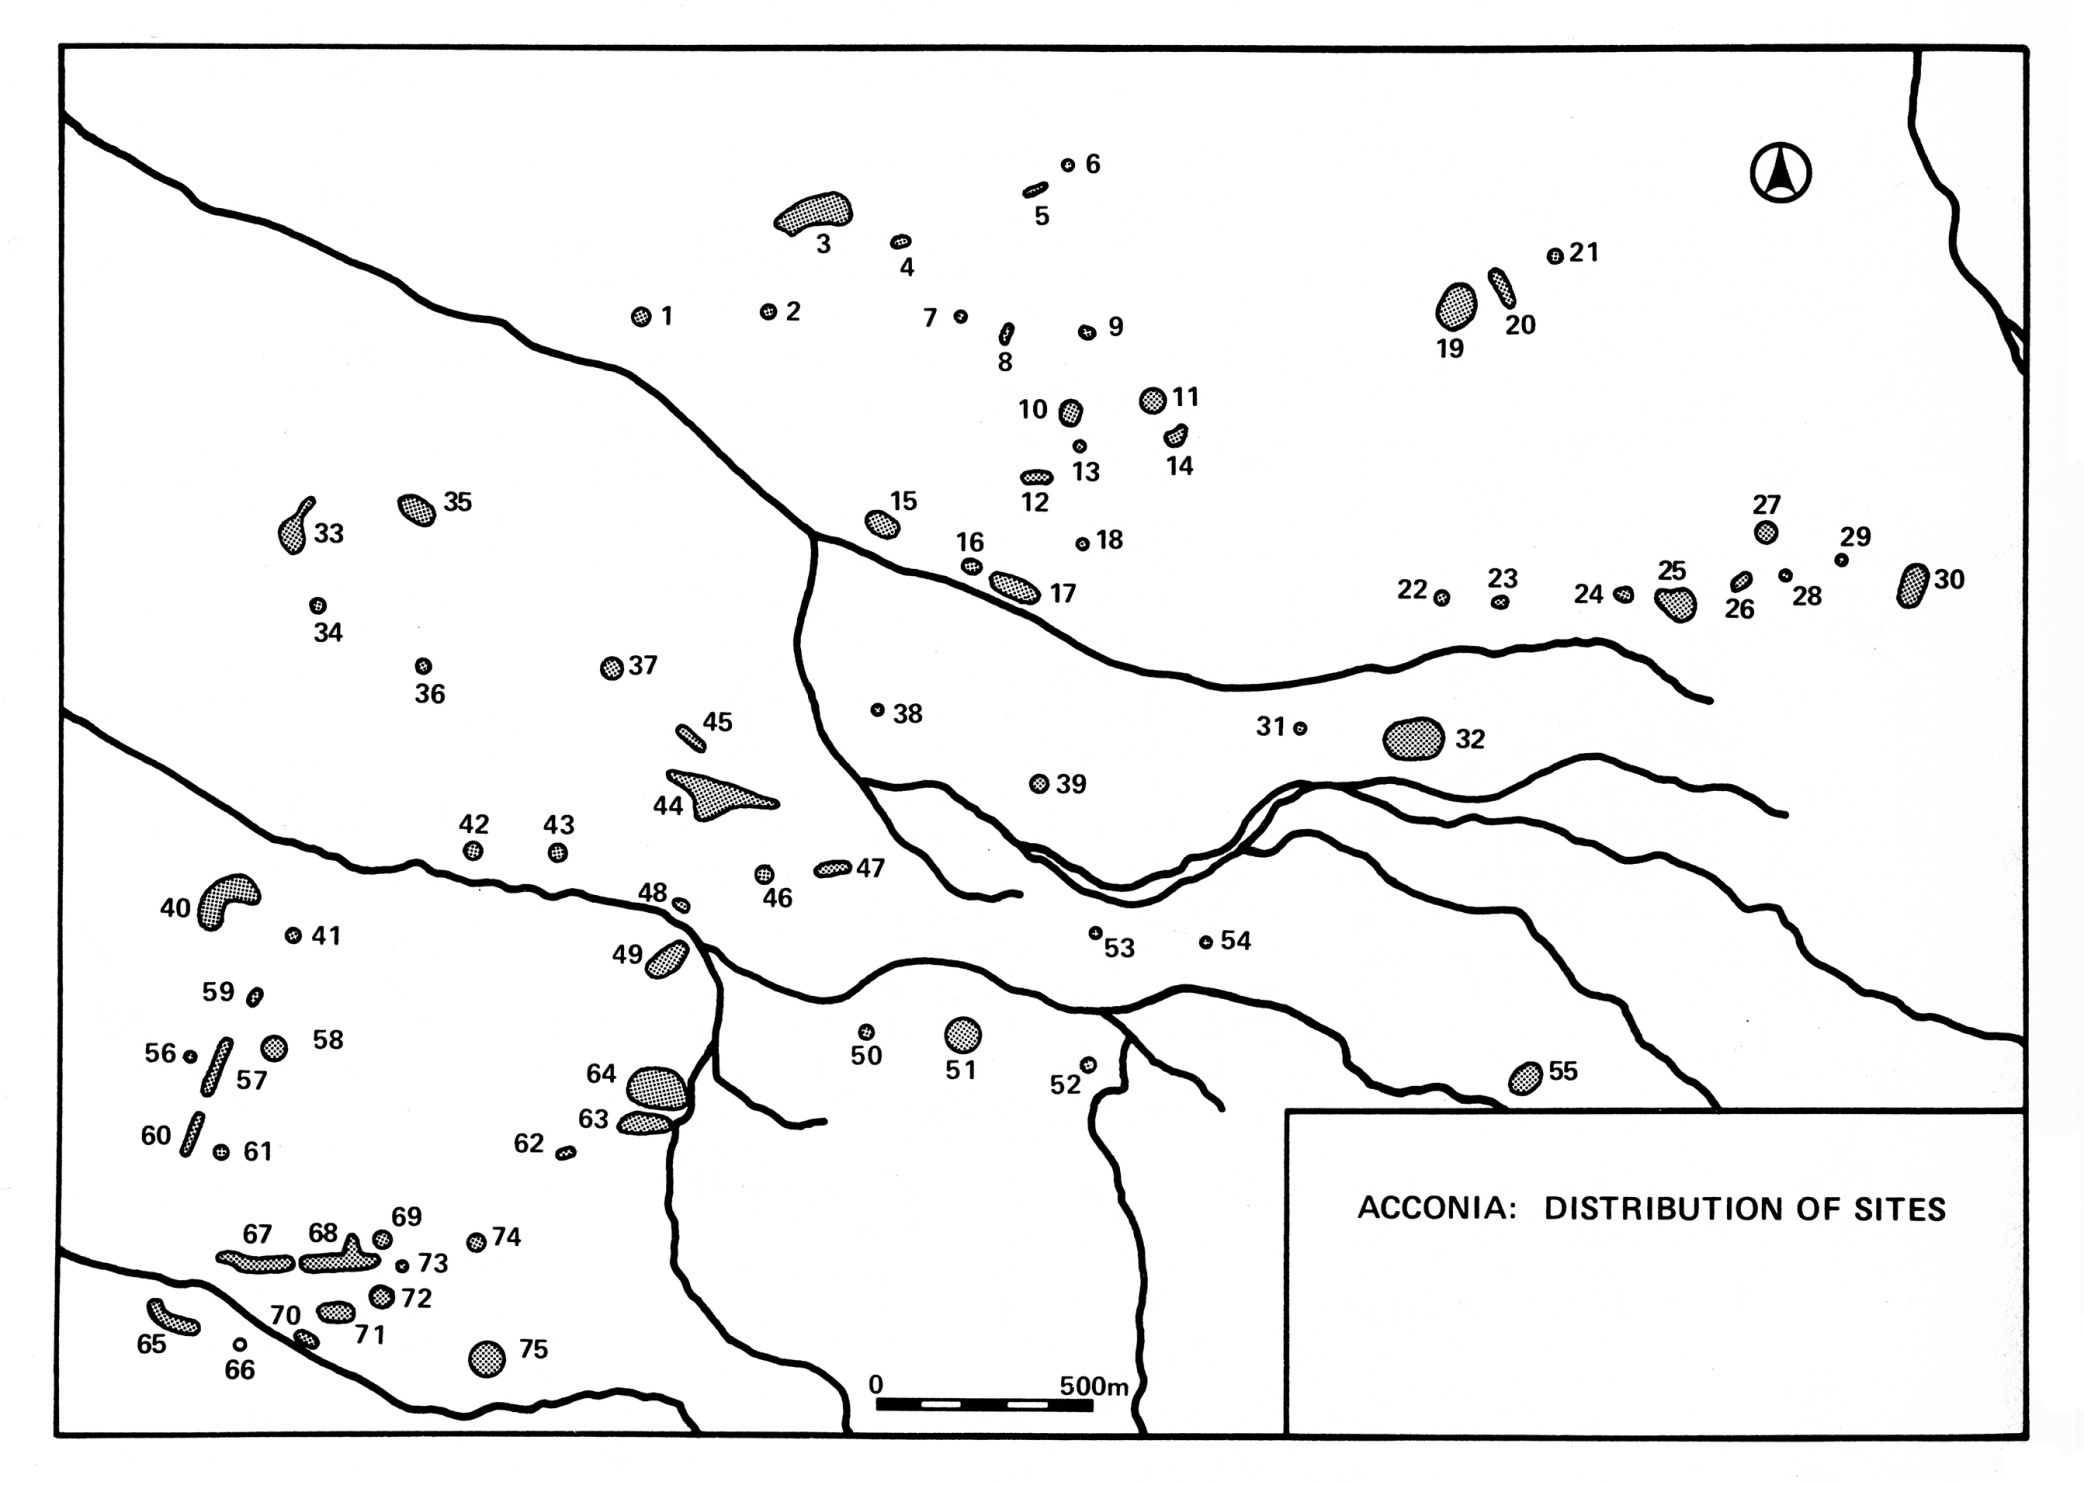
Map of the prehistoric sites found during the first four seasons of the Acconia Survey, 1974-1976. (Ammerman 1985: Fig. 3.1)
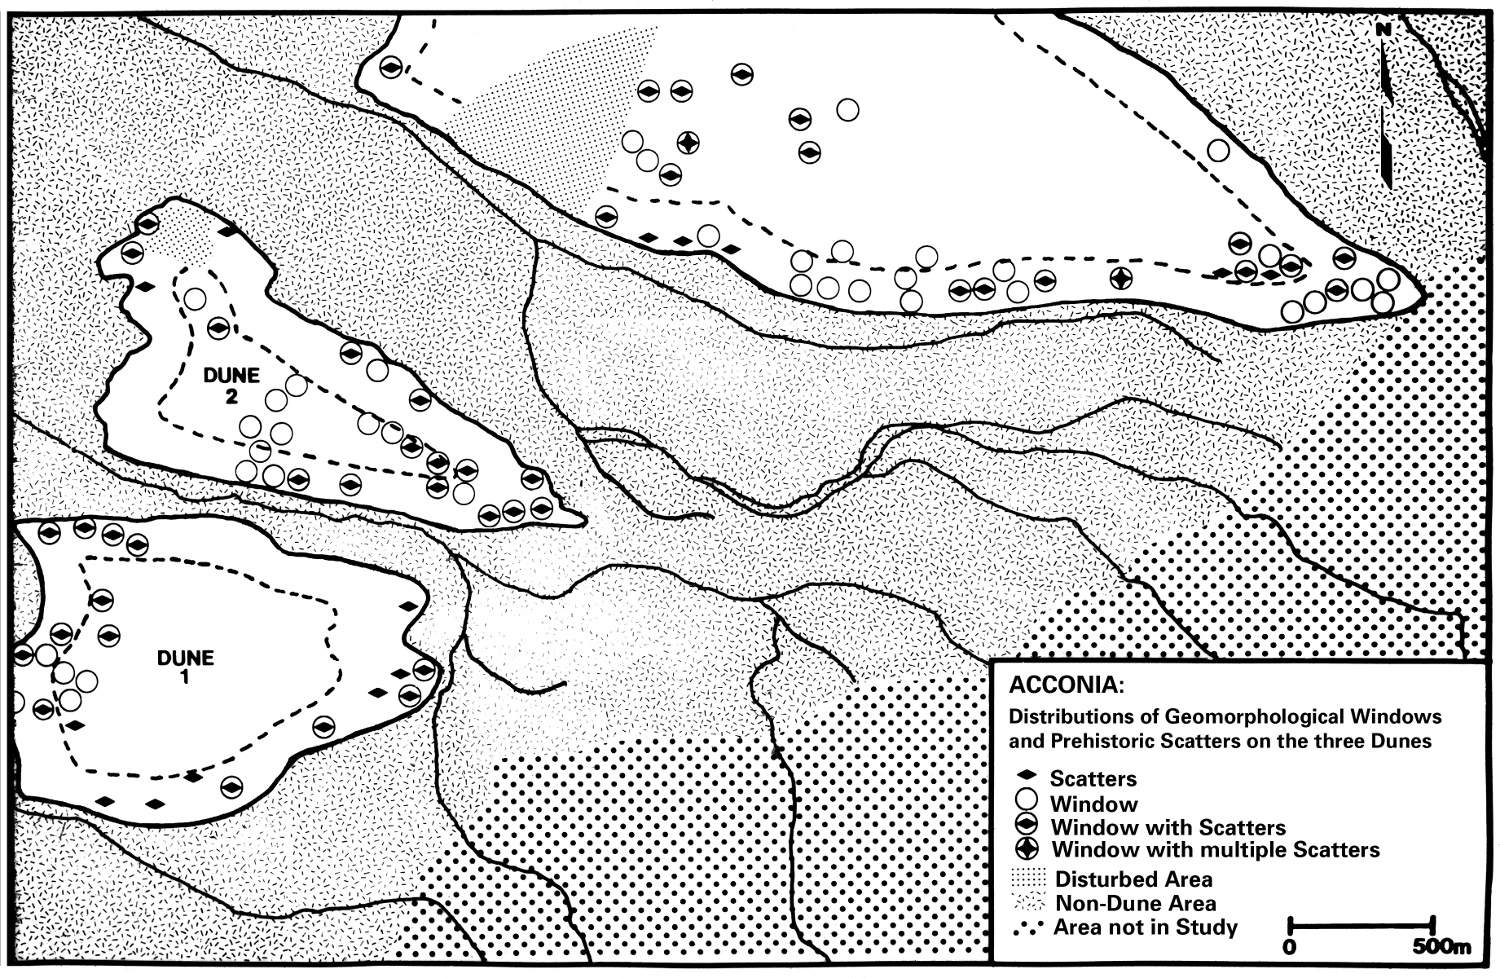
A new idea slowly began to form during these surveys. Two soil specialists from the University of Amsterdam were able to show that much of the landscape where the surveys had been successful had experienced artificial leveling, wind erosion, or some combination of the two within the past 20 years thereby bringing the Neolithic scatters to the surface. These exposed areas they called “geomorphological windows.” A map of these windows at Acconia was created from aerial photographs by graduate students who had no prior knowledge of the distribution of sites there and this map was then compared with one of the sites’ actual locations. The results were astonishing: while altogether the windows only covered 5% of the area, 75% of the sites discovered were found within them. The paper featuring these results can be found here. Thus the close relationship between windows of visibility and site recovery clicked together. In order to better understand human agency and its impact, the longitudinal study of land use in Acconia began.
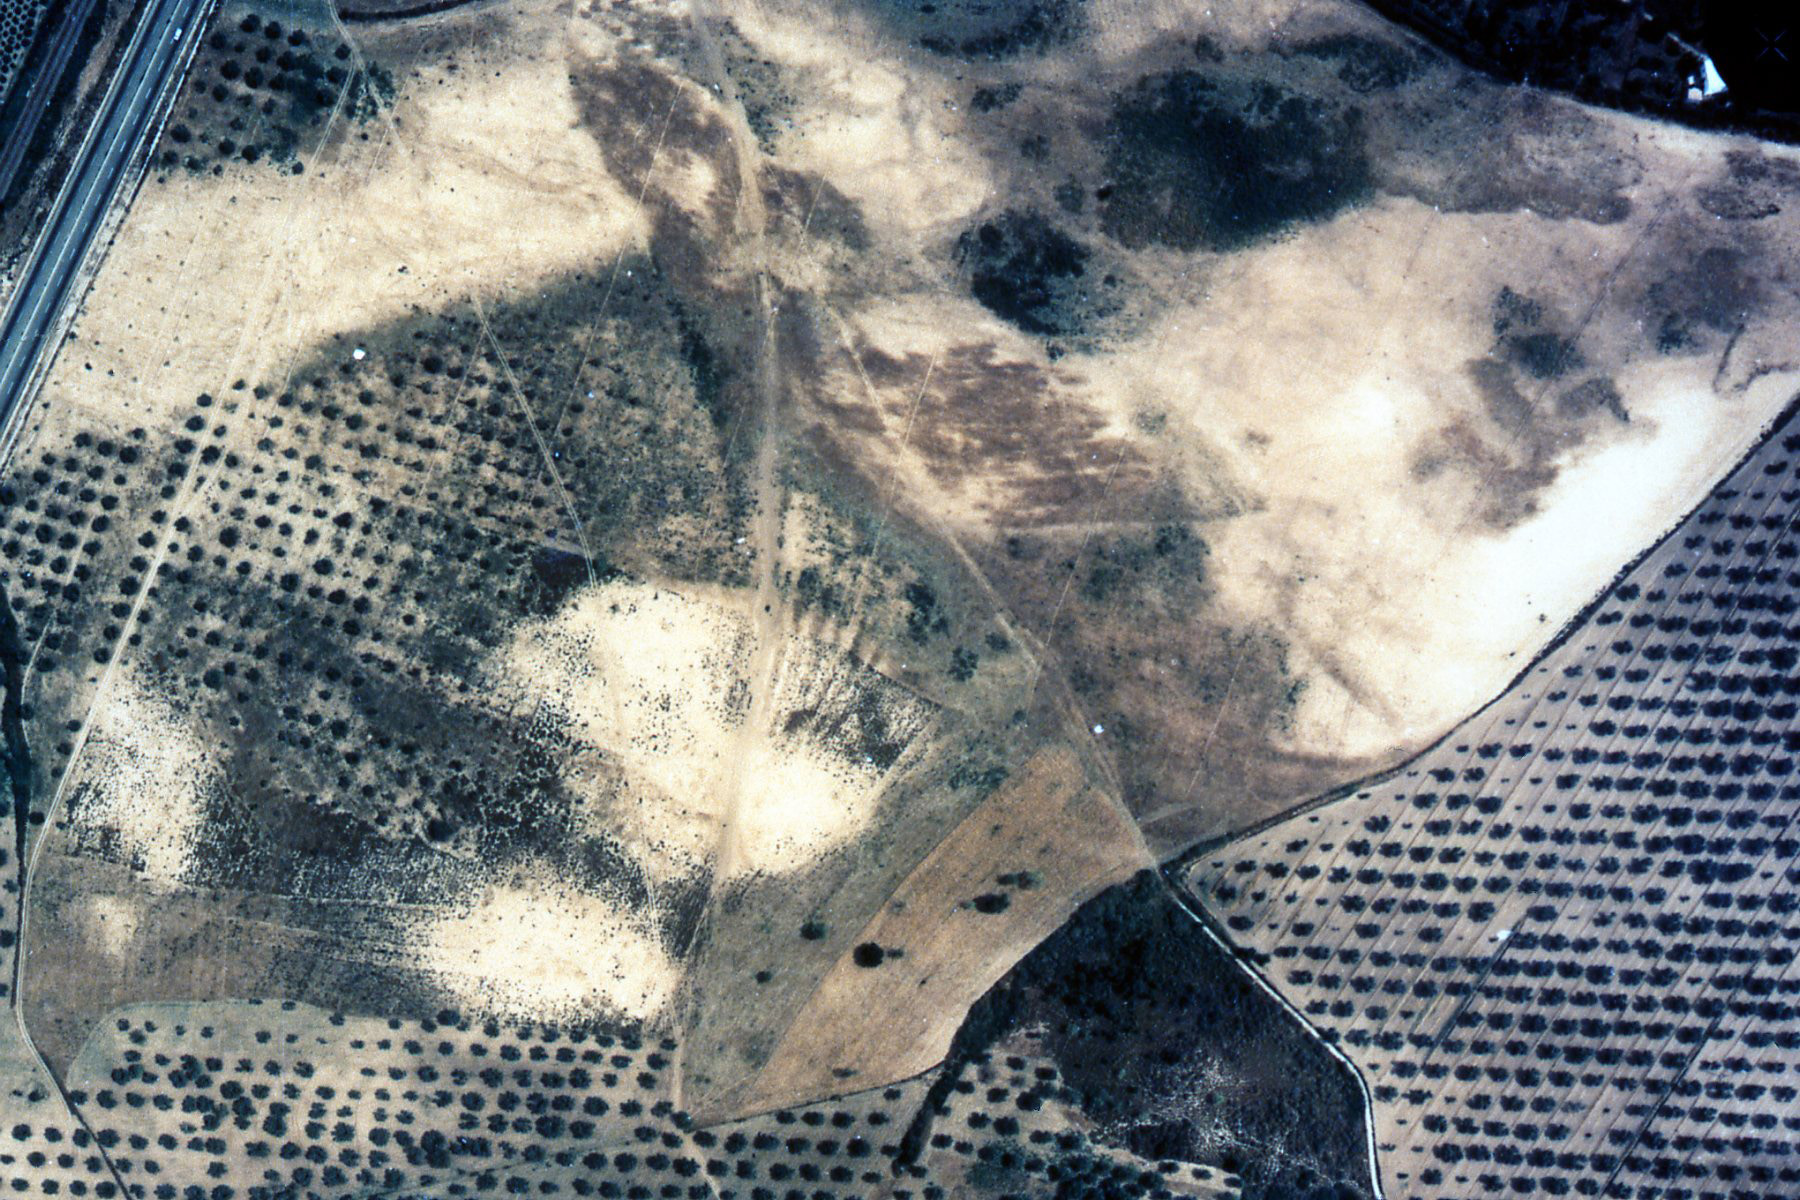
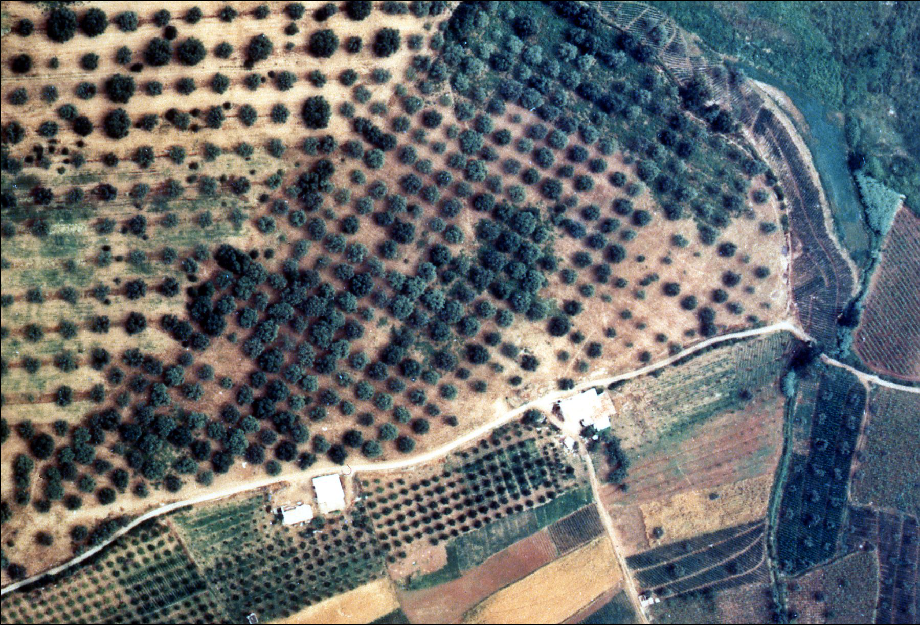
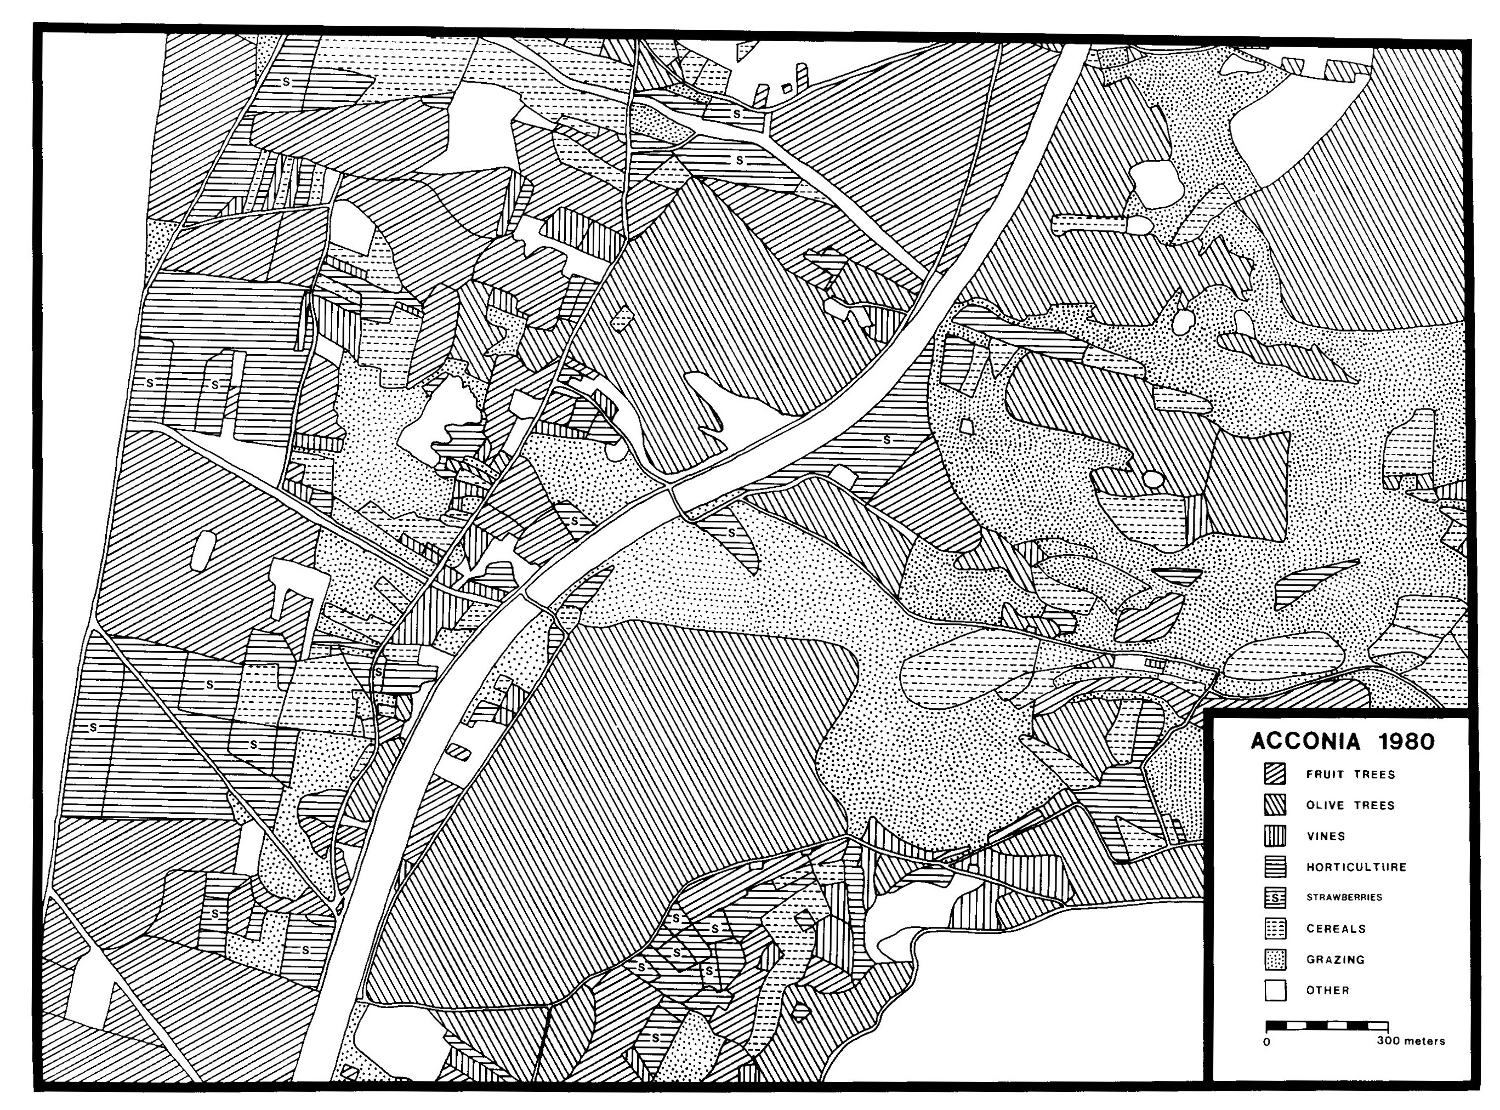
The first mapping of land use at Acconia was accomplished through the consultation of aerial photographs and land ownership records. The latter were easily obtained from the cadastral office of Calabria, but they would have been worthless without the former. In order to be usable for the project, the aerial photographs required a spatial resolution that was not usually available. By chance, however, the team was able to have photographs flown specifically for them in color at a scale of 1:5000 (as shown, below left.) From these, they created the first mapping of the longitudinal study (below right.) The first paper from the study can be found here.