In the fields of Anthropology and Archaeology, the number of longitudinal studies conducted for 20 years or more remains low. This study is now in its 36th year. Since 1980, we have mapped the landscape at Acconia every nine years on a detailed, field-by-field basis. An article discussing the changes between 1980 and 2007 can be found here: Ammerman 2013, with further information in this document: 2010 Notes. This page contains various aspects of the documentation of the longitudinal study.
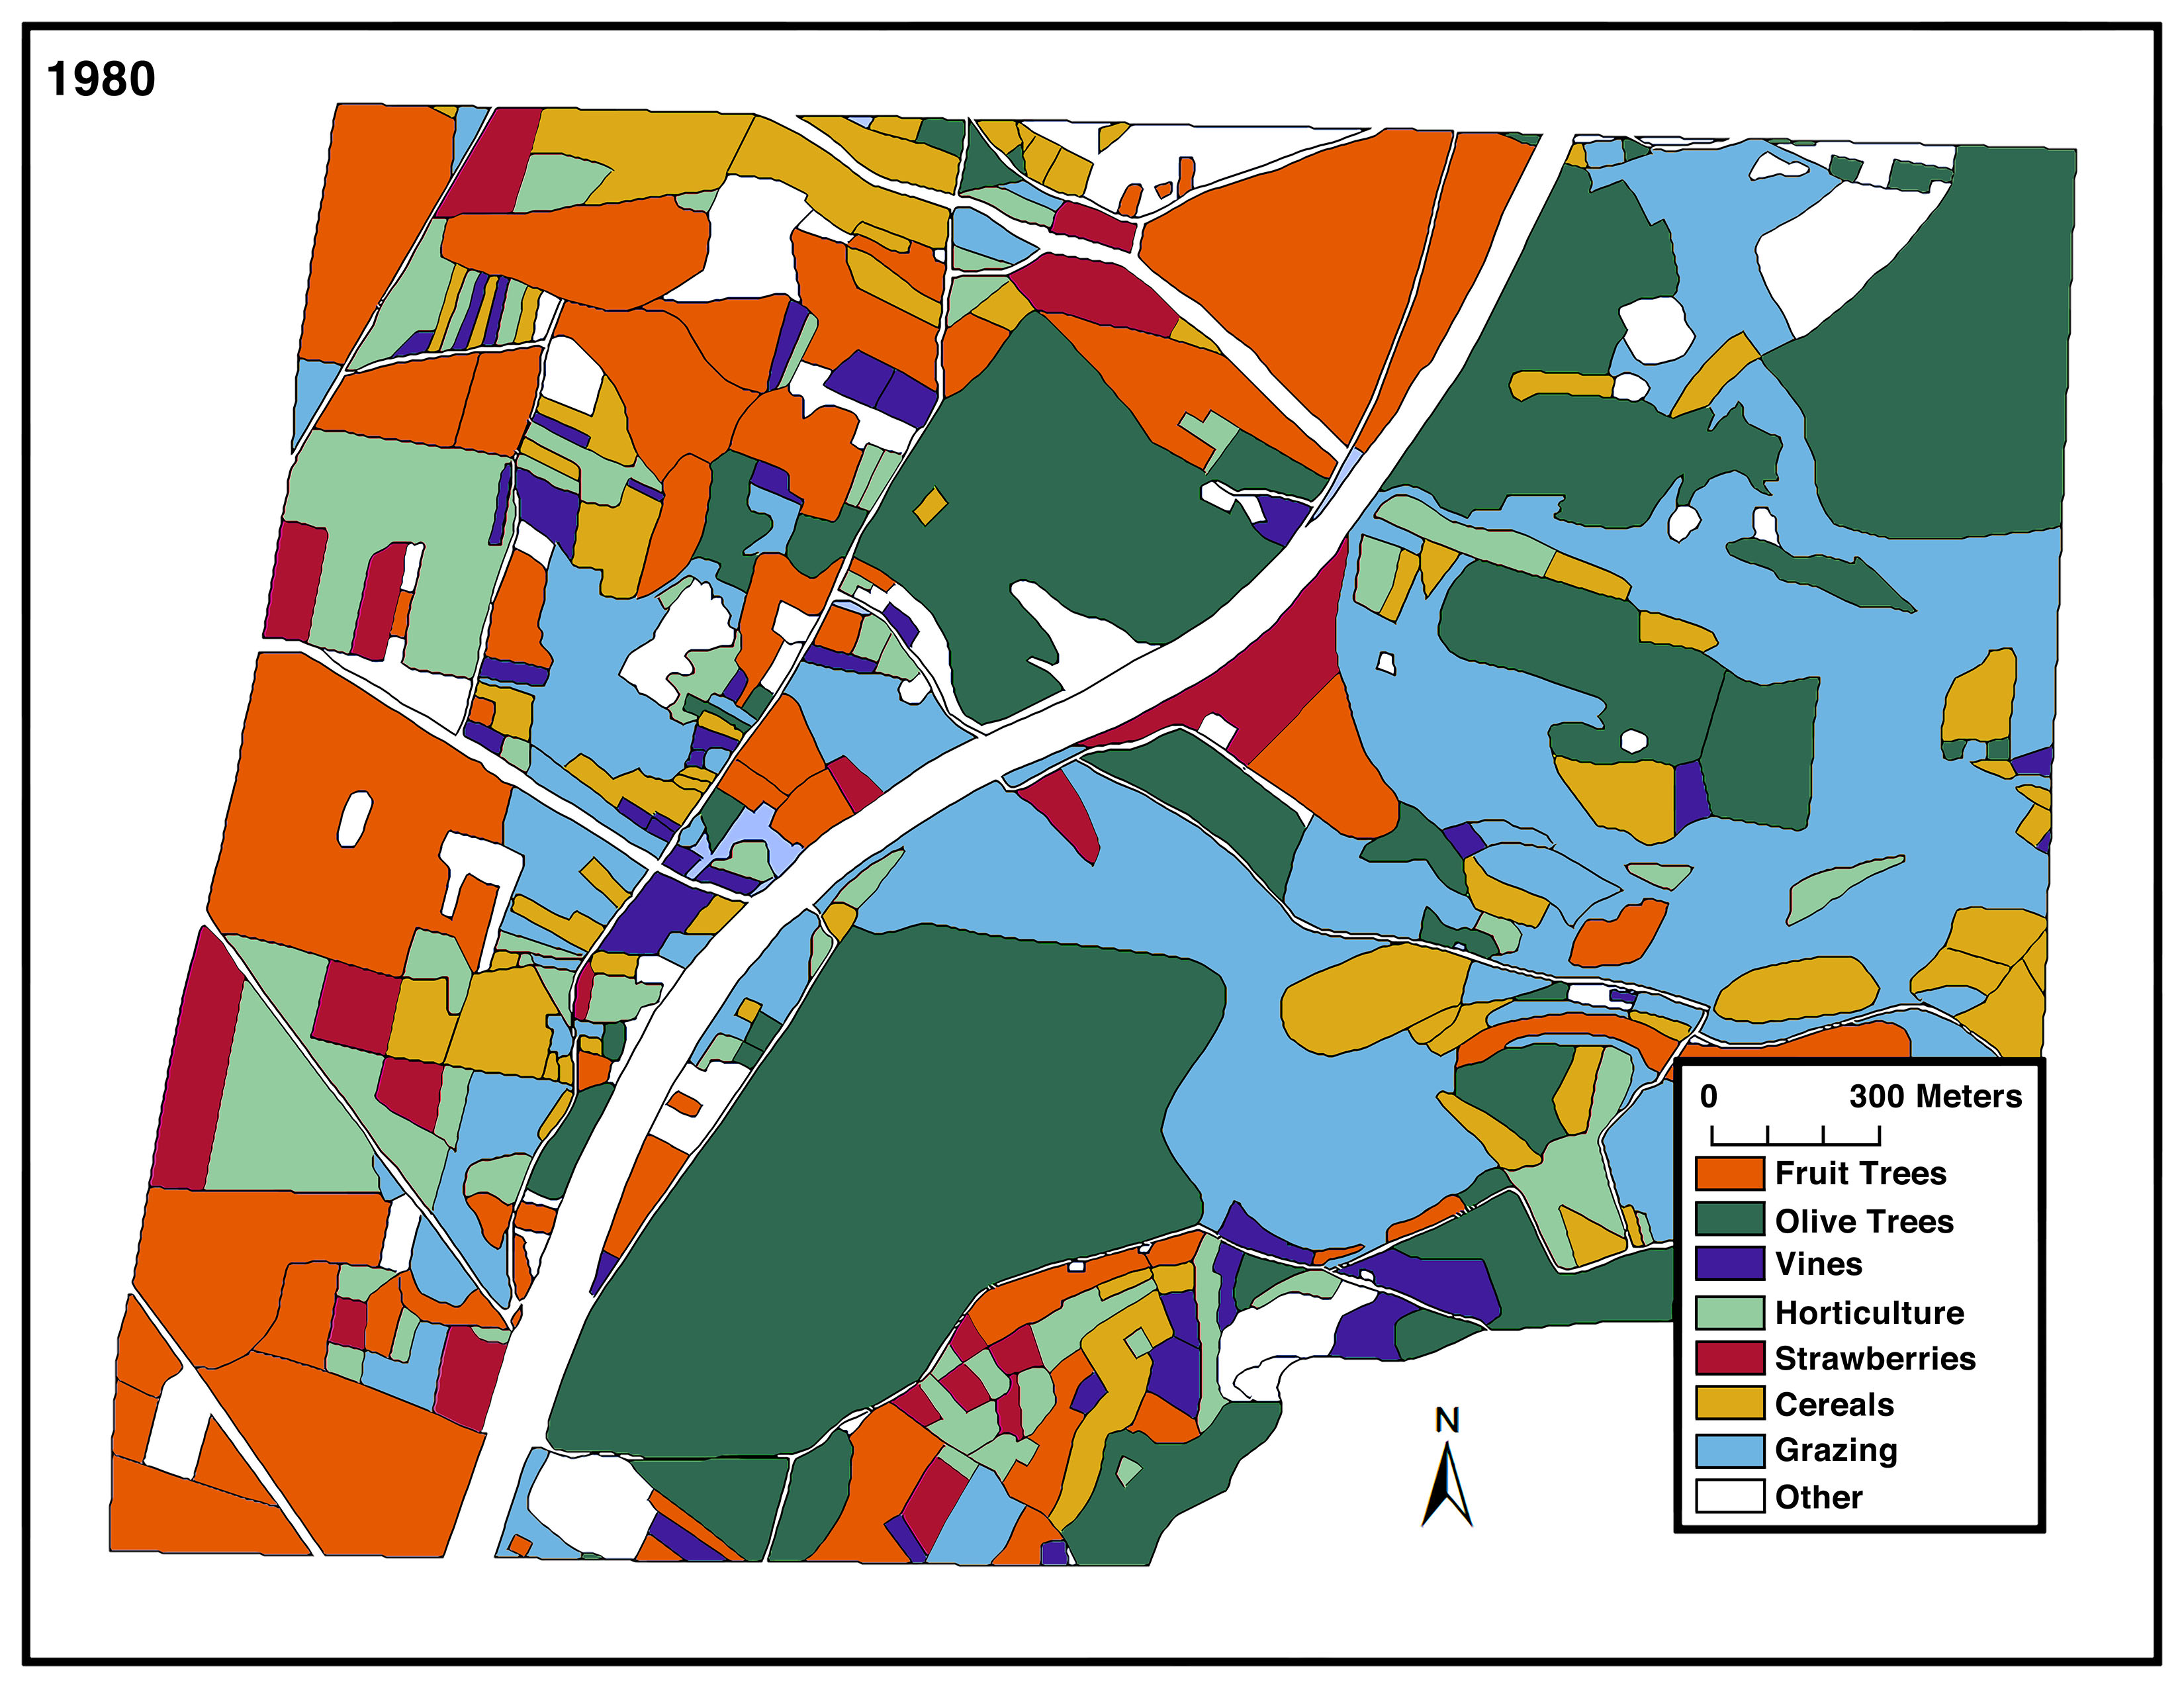
Map of land-use at Acconia in 1980. (Ammerman 2013: Fig. 4)
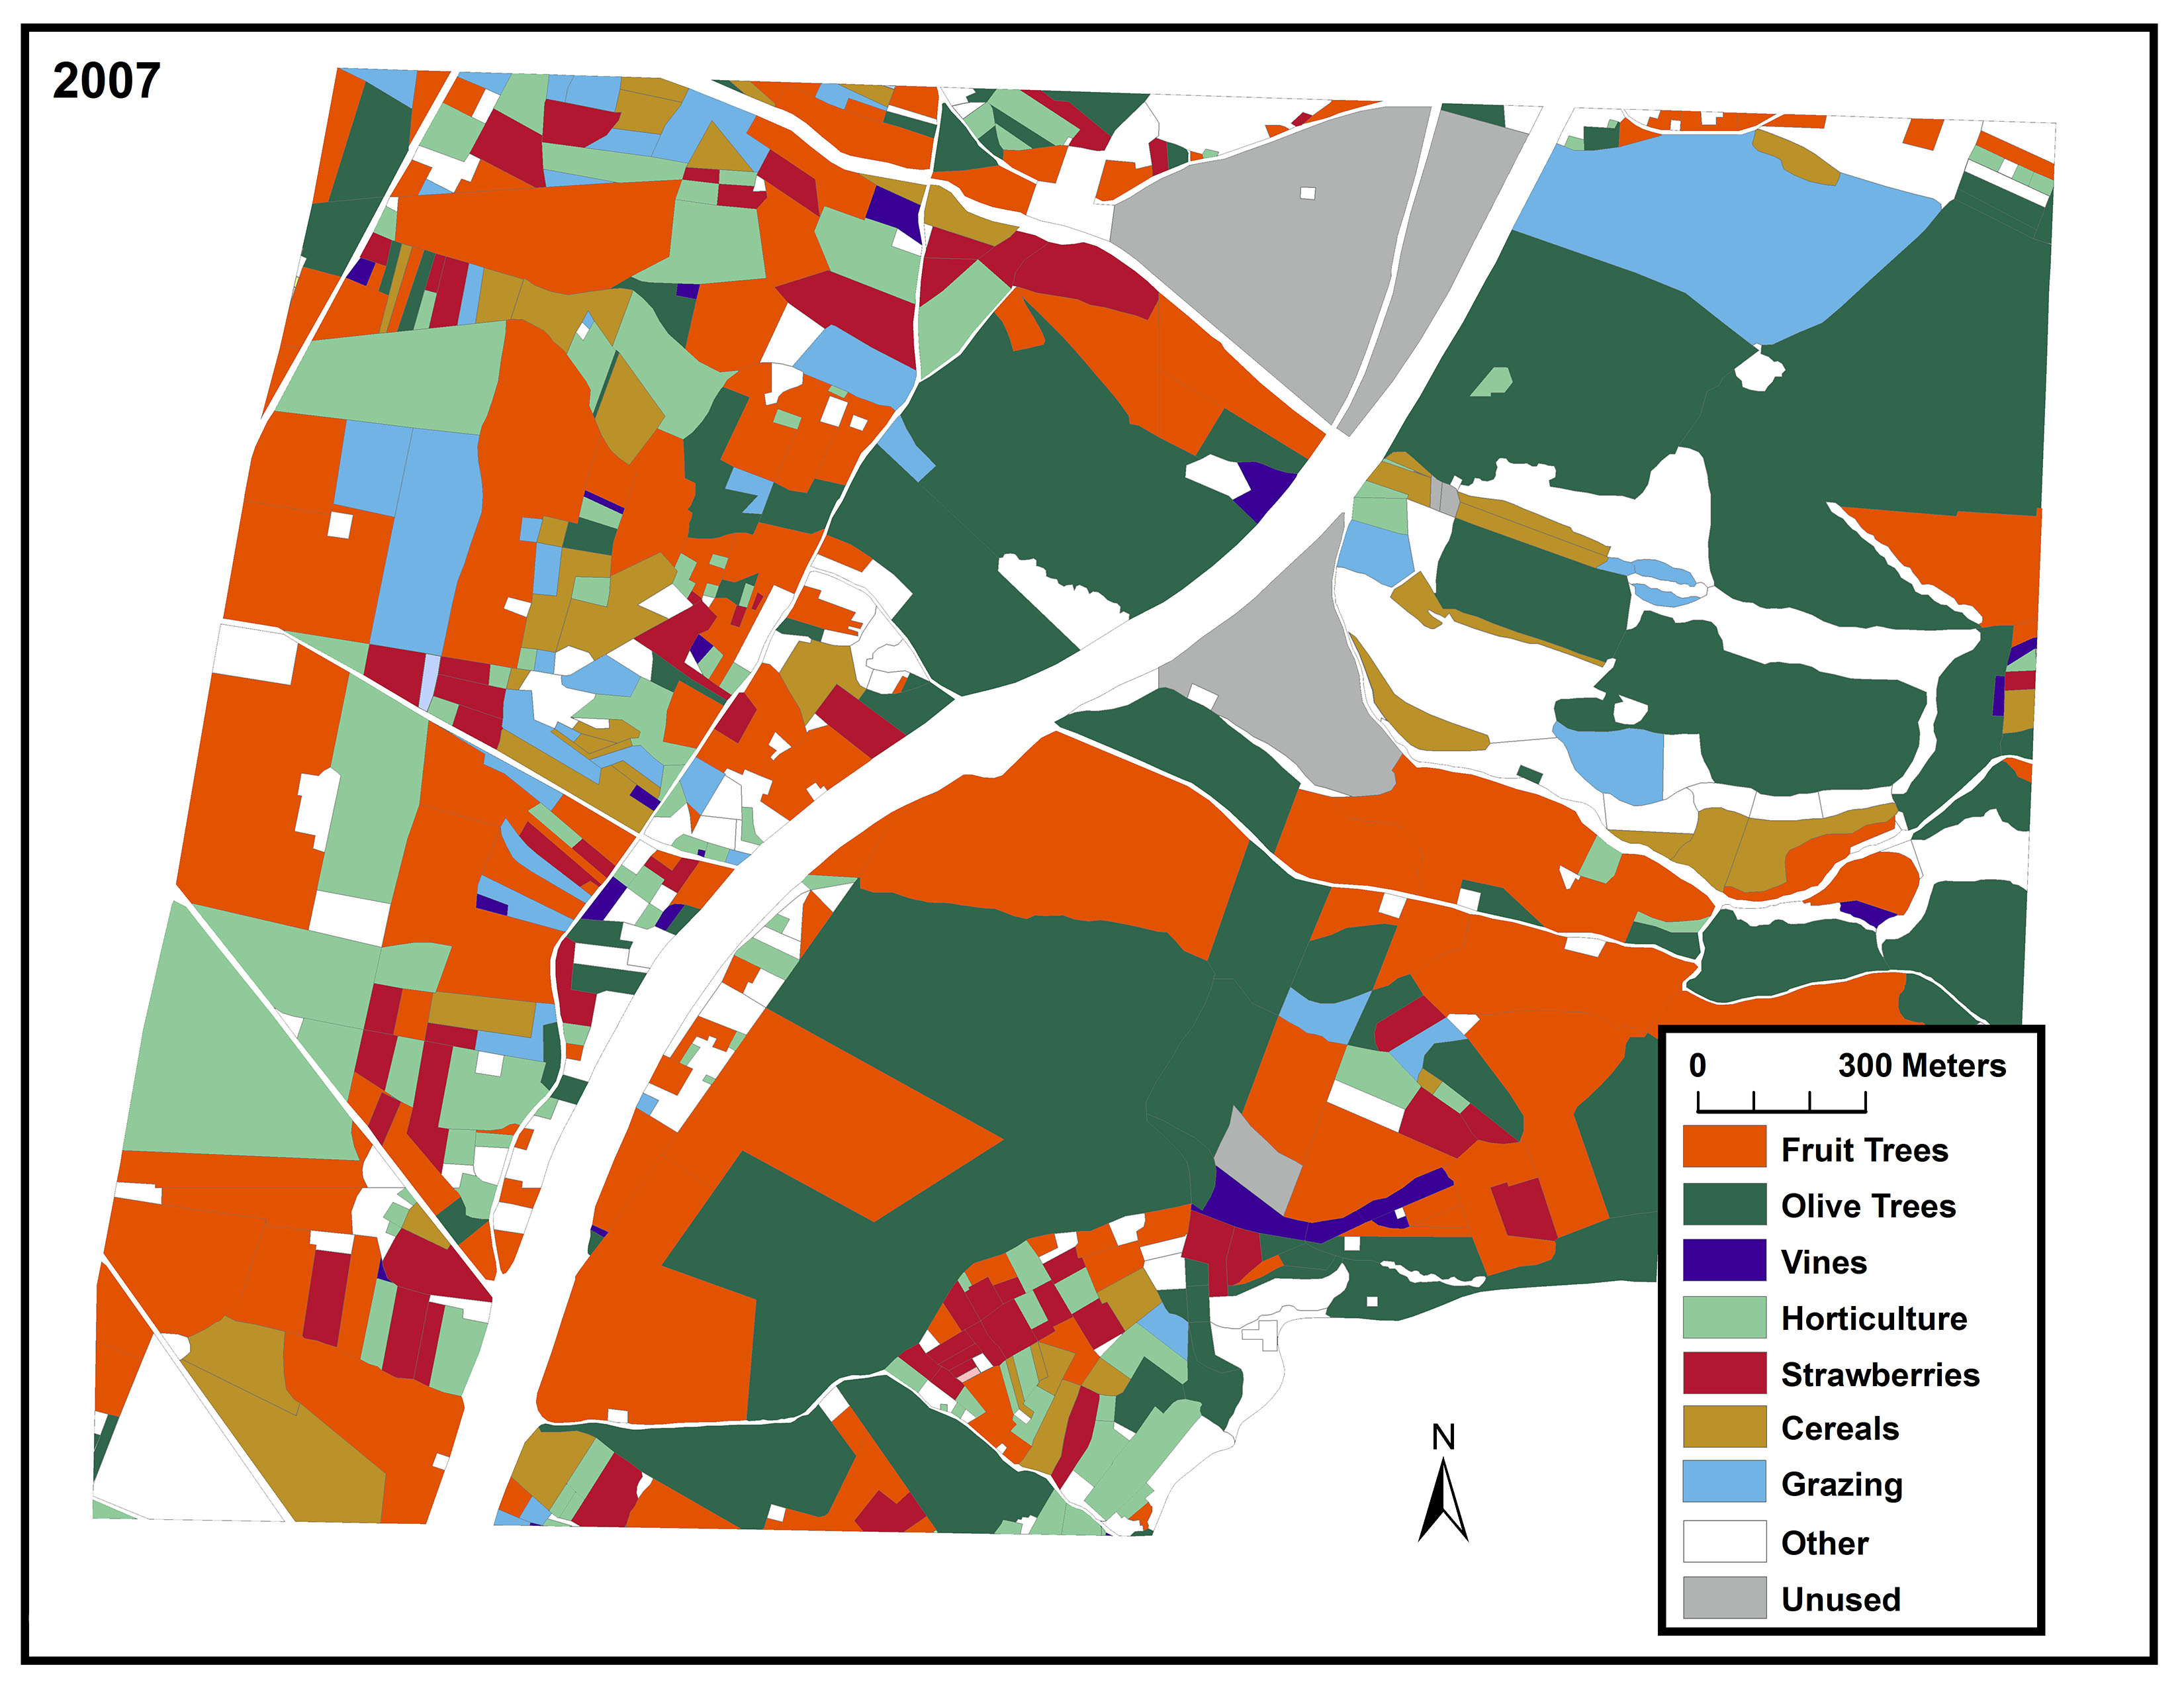
Map of land-use at Acconia in 2007. (Ammerman 2013: Fig. 5)
Using everything from aerial photographs and cadastral records to satellite imagery over the years, the investigations at Acconia have been able to produce maps showing the land use at Acconia field by field. Above are two ArcGIS maps from the first mapping in 1980 and from the fourth mapping in 2007. We began using this software in 2007. The original maps were not so flashy, having been created by more traditional means.
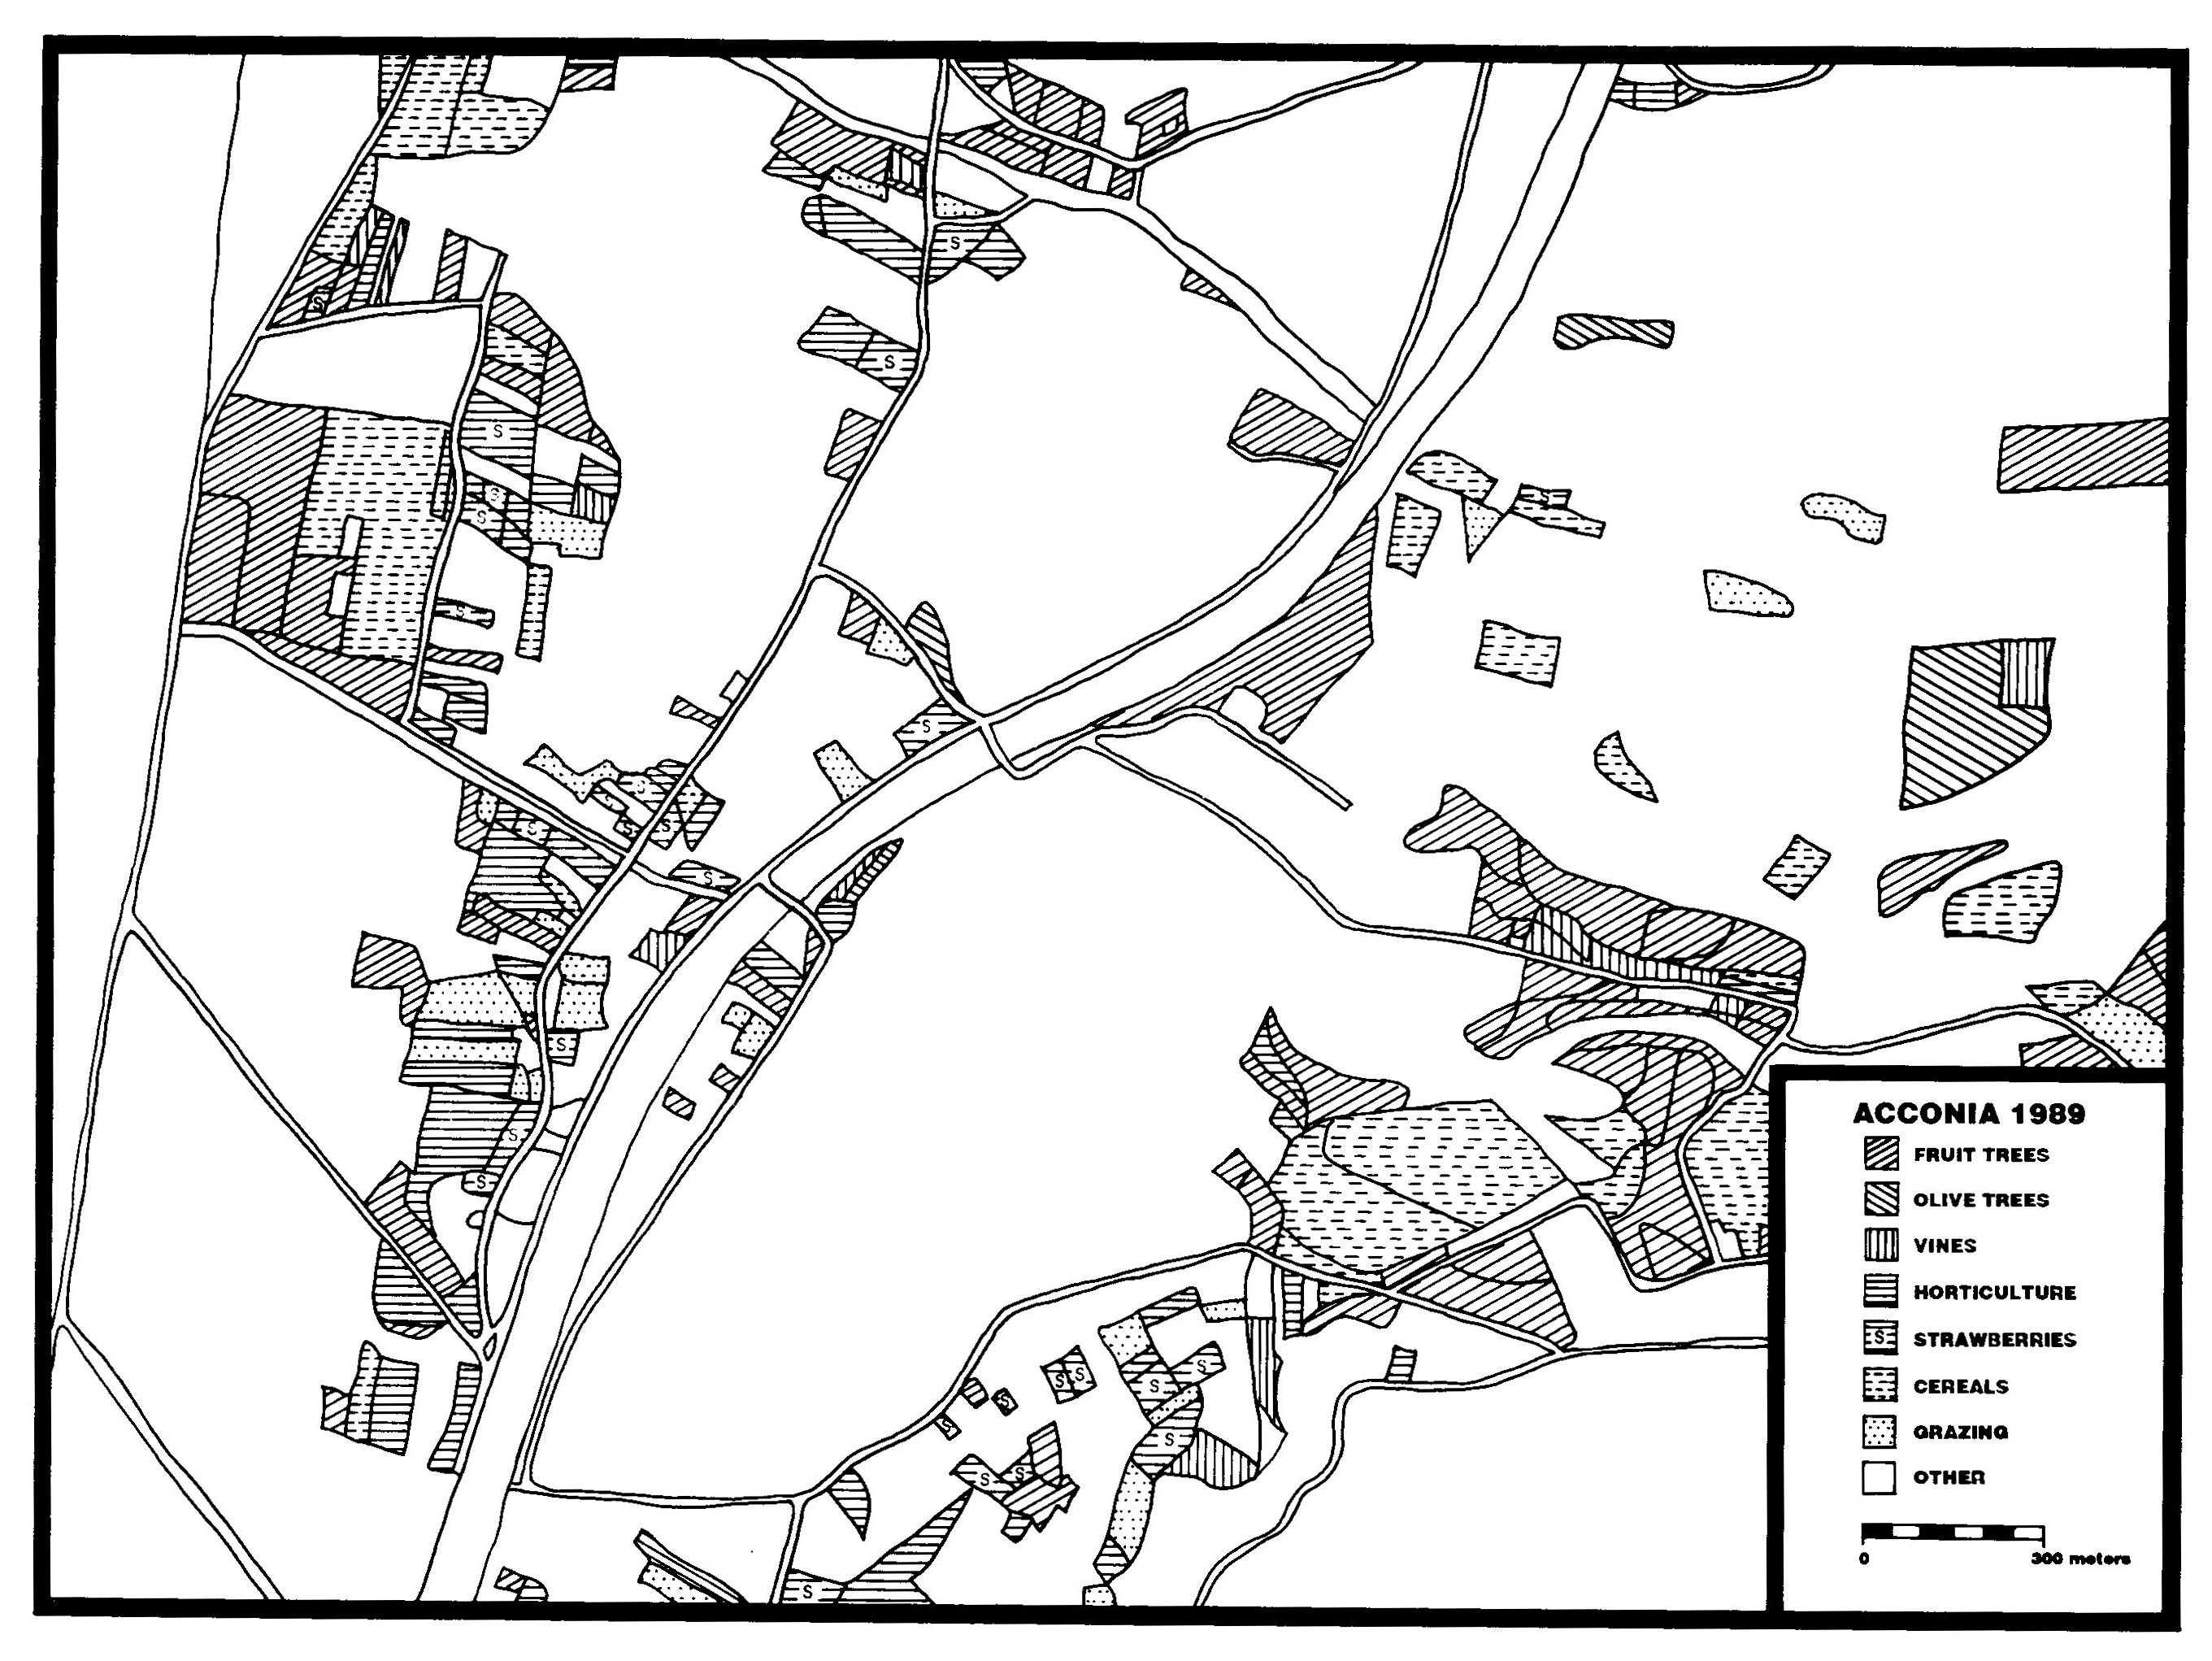
Map showing those fields at Acconia where land use has changed between 1980 and 1989. (Ammerman 1995: Fig. 2)
One of the very first maps produced by the study, this hand-drawn map shows the fields which have changed use between the first mapping in 1980 and the second in 1989 with their new use. The map was created using a combination of land ownership records from the cadastral office at the time in Catanzaro (the office, below left) and aerial photographs at a scale of 1:5000 (example, below right).
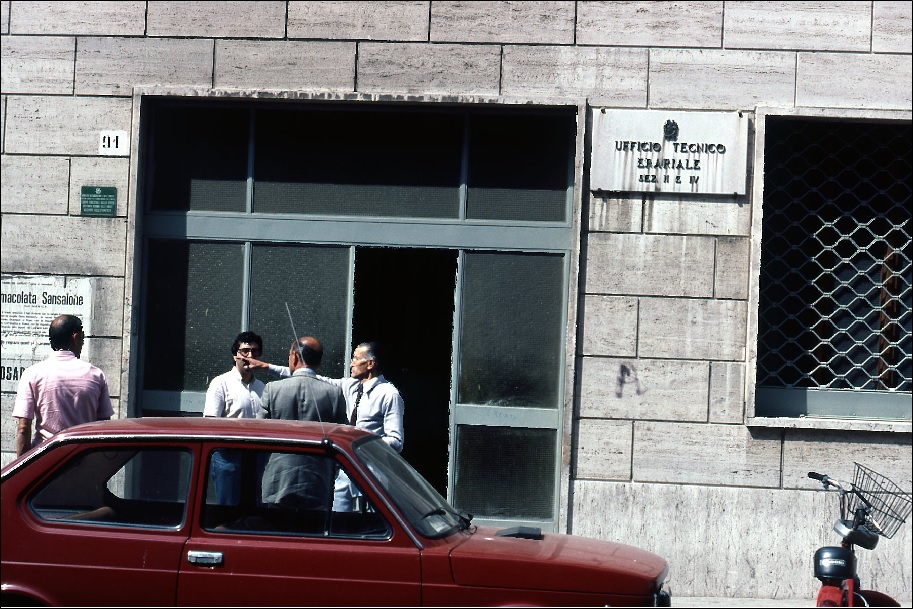
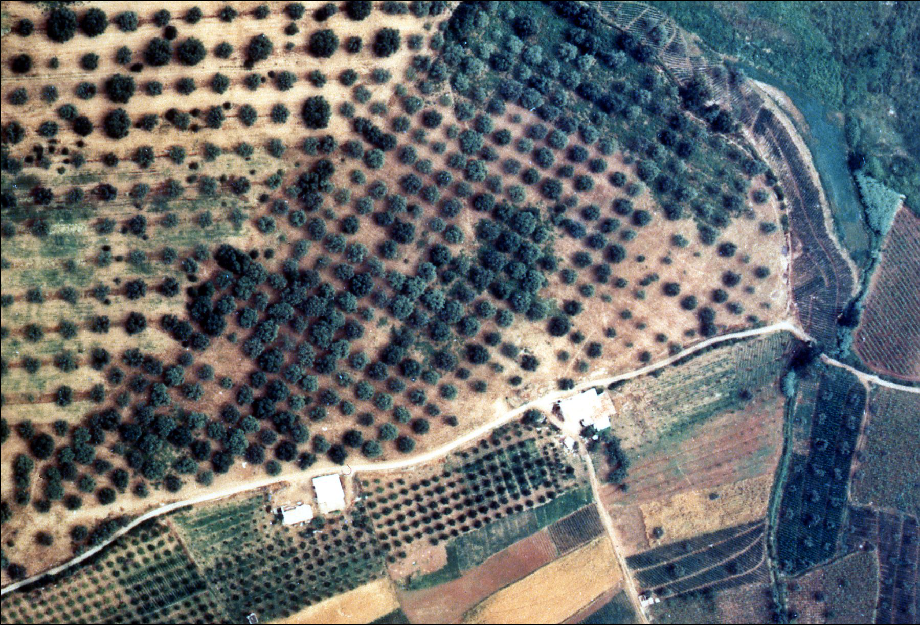
The high quality aerial photographs were a key element which allowed the longitudinal study to take shape. They would have been prohibitively expensive if it had not been for the good fortune of the project to receive them as a gift. As technology has improved over the years, the expensive photographs have no longer been necessary.
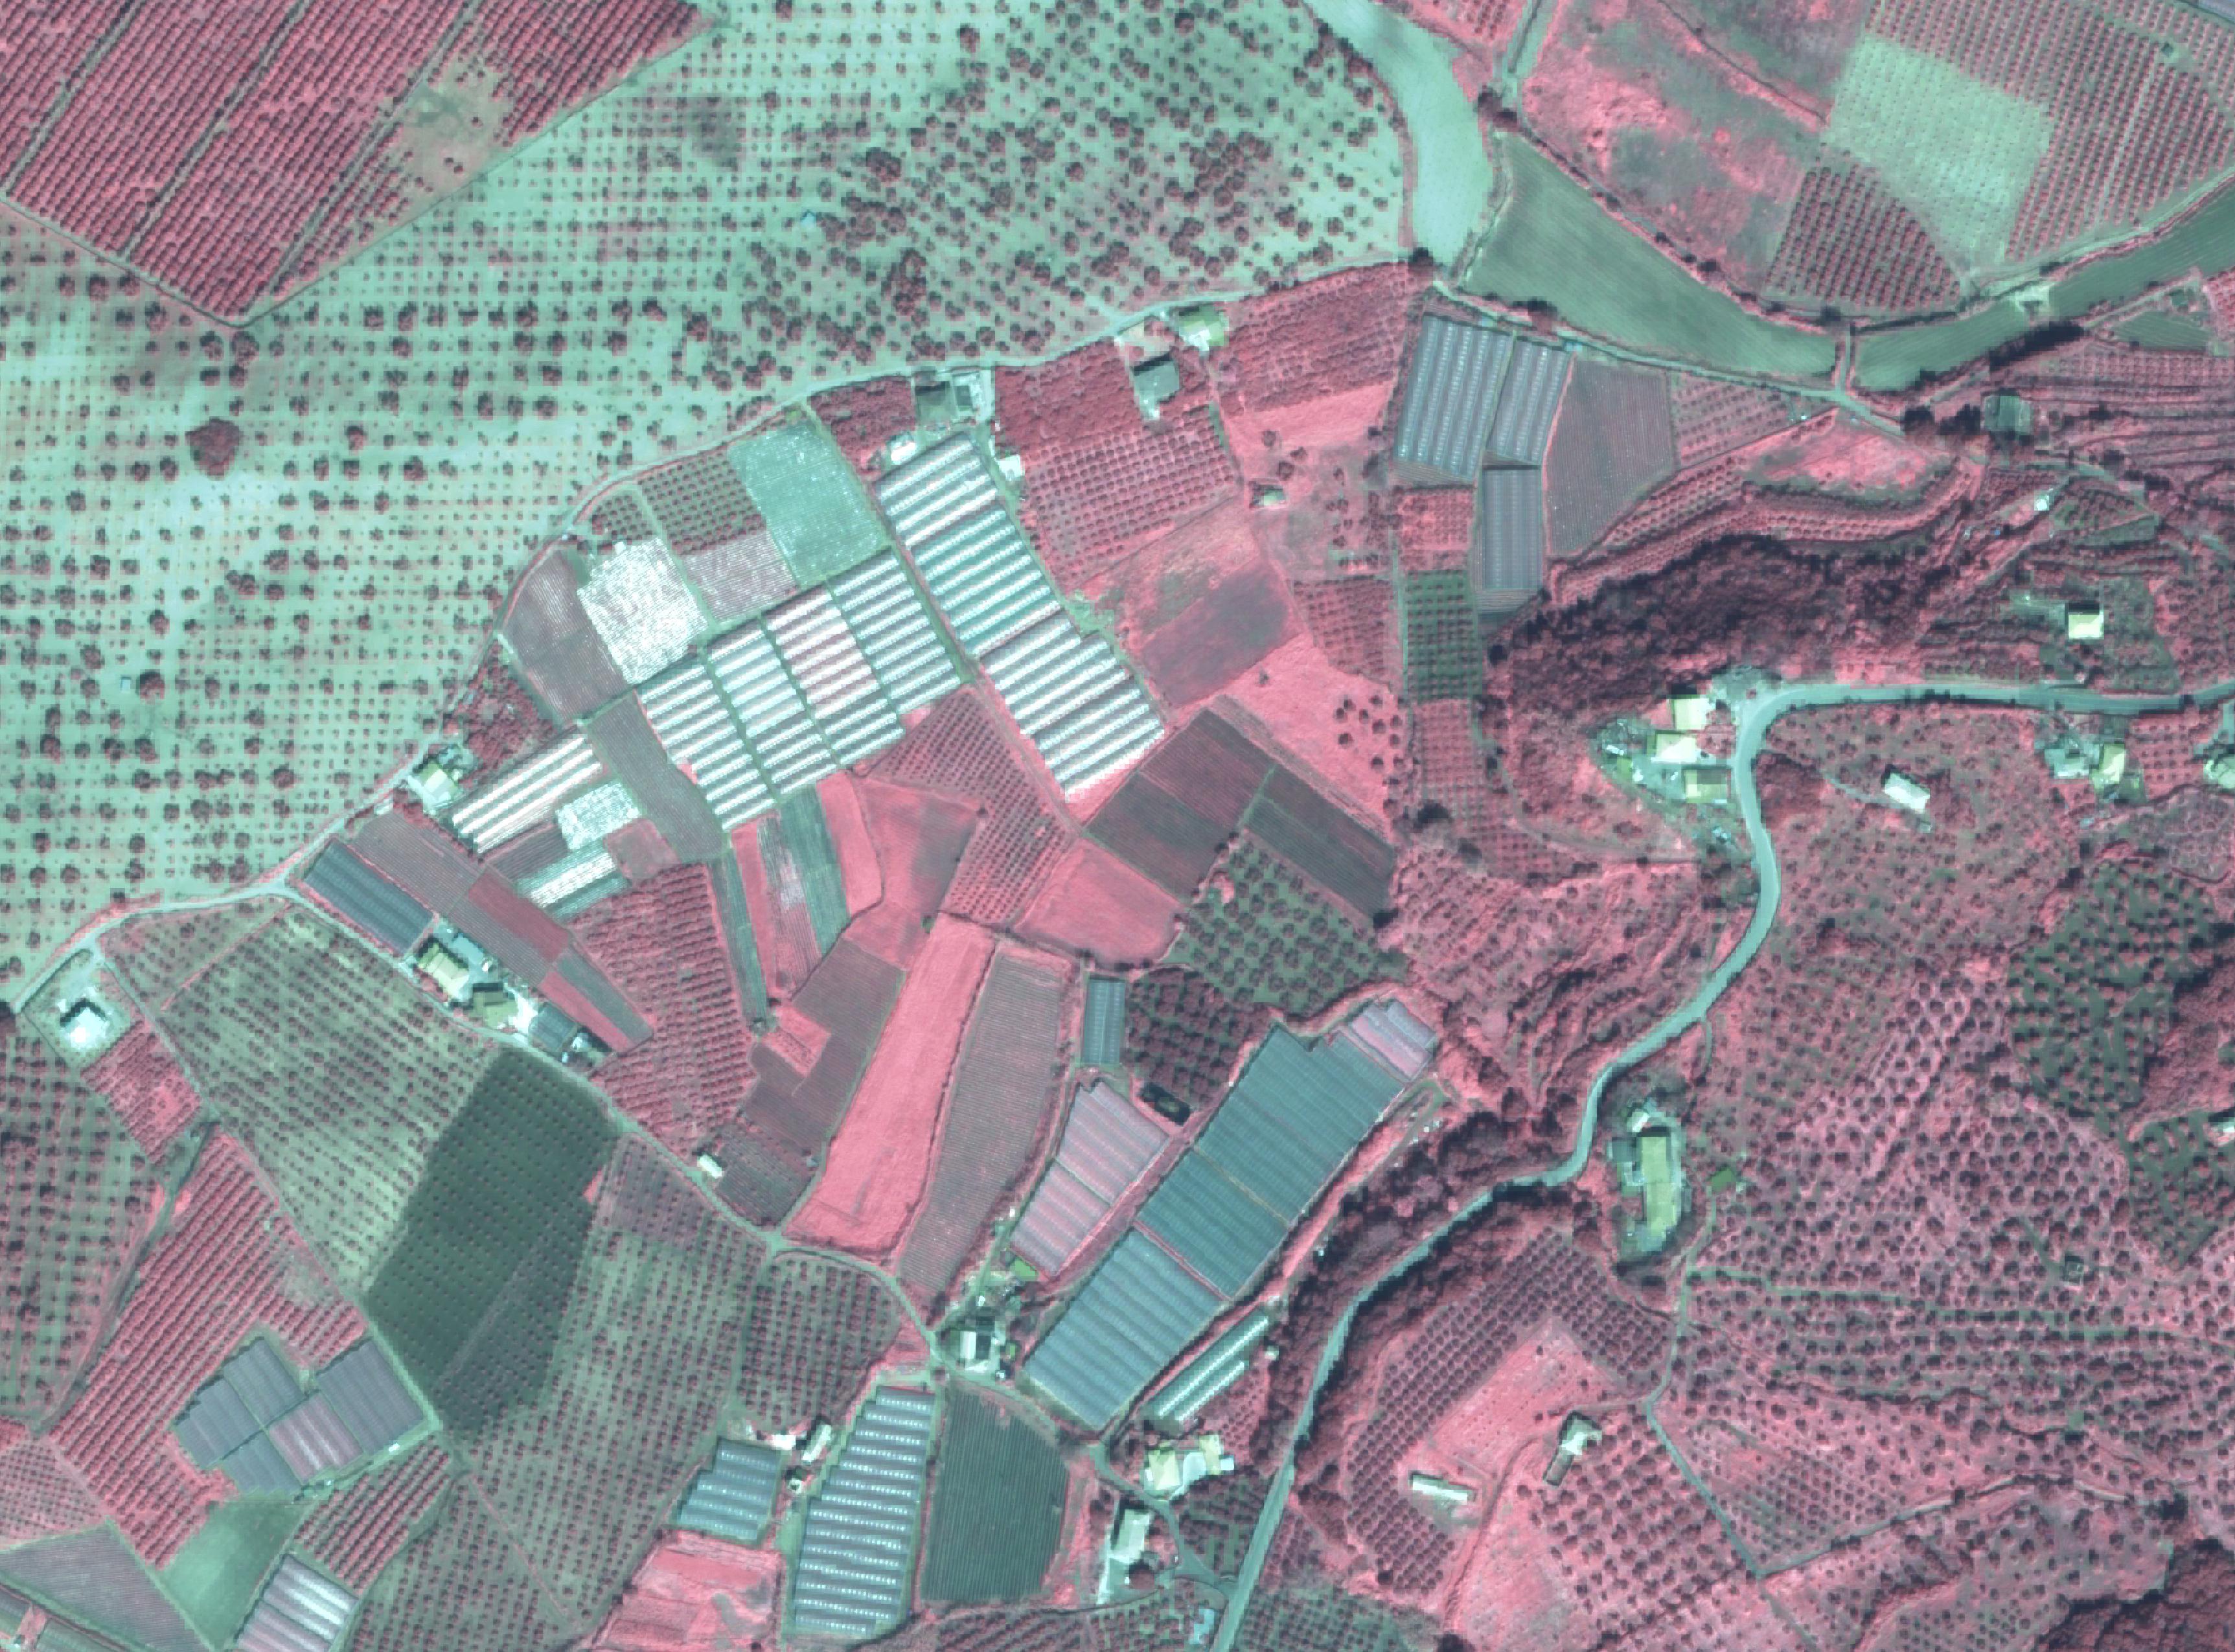
For the mapping in 2007, the project first used Quickbird satellite imagery, which produces pictures such as the one above, to determine field boundaries and their uses. The bright, colorful maps as seen at the beginning of this page are then created using the ArcGIS computer software.
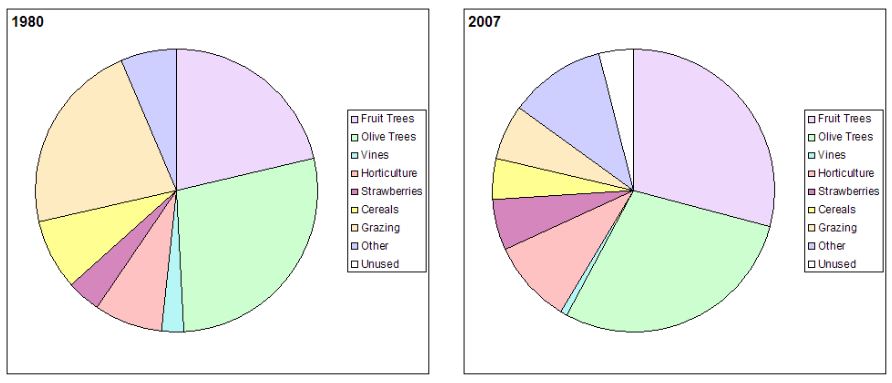
In order to present the data, the field information has been organized in a number of charts and graphs such as these pie charts showing how the proportion of different crops have changed over 27 years. In addition, visuals have been produced looking for more specific characteristics of Acconia’s landscape.
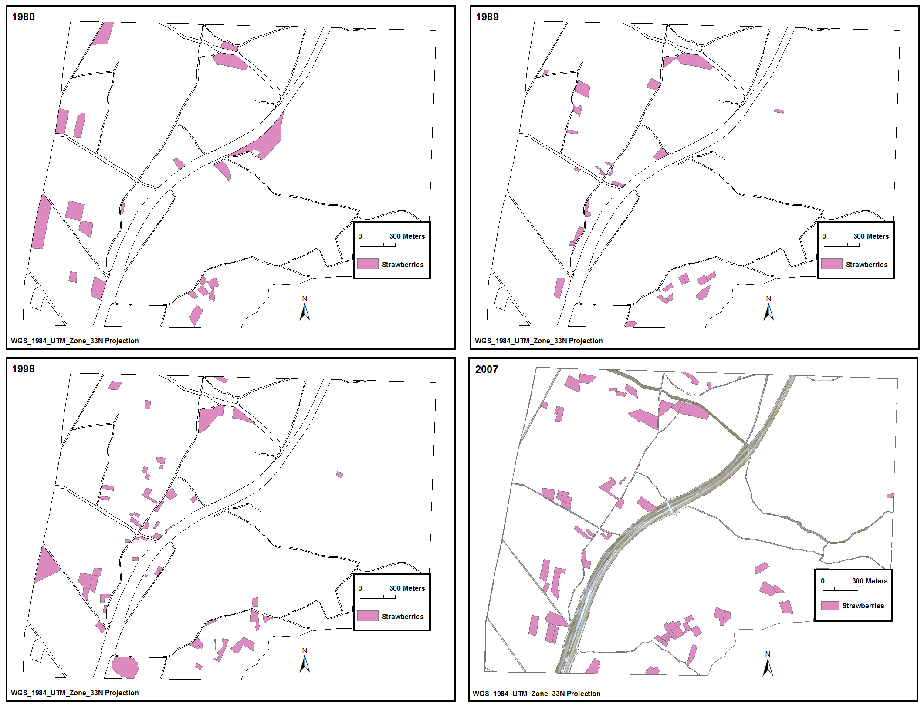
Maps showing the fields where strawberries were grown in 1980, 1989, 1998, and 2007. (Ammerman 2013: Fig. 6)
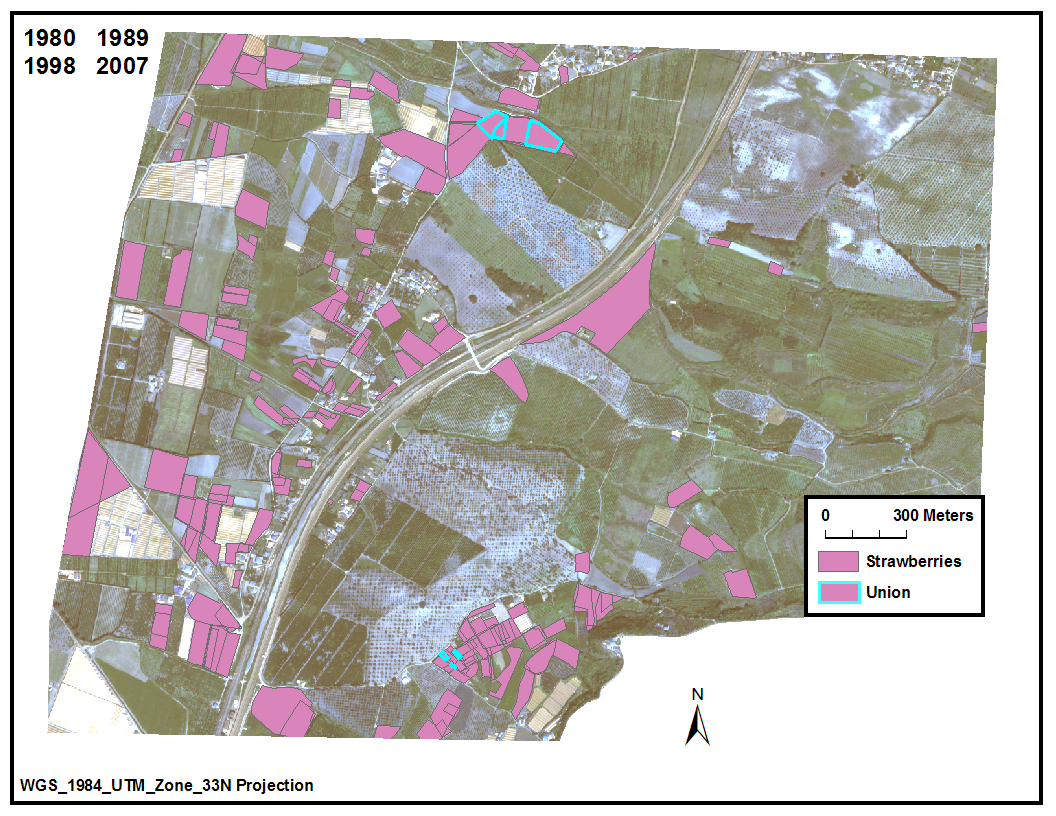
Map bringing together all strawberry fields at the times of the four mappings. (Ammerman 2013: Fig. 7)
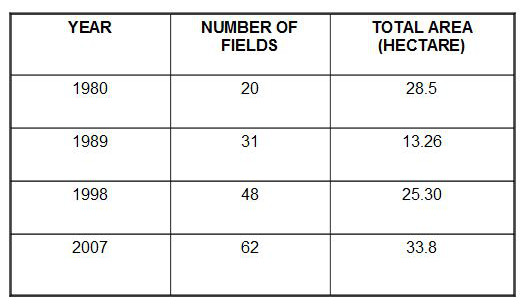
The fields of strawberries have been the most dynamic features of the Acconia landscape. The table above presents the change in strawberry production through the number and size of the fields. The four maps that follow correspond to the first four surveys and show the locations of those fields. The last map finally shows the unions, i.e. the fields from all four years with those present during every single mapping, outlined in blue. There were only 6 unions, a sign of the dynamic character of this sector of production. This has continued between 2007 and 2016. Despite a reduction in the number of fields from 62 to 47 in 2016, many new strawberry fields have come into being—only 20 of the current fields were also producing strawberries in 2007.
The longitudinal study has not finished yet, and we are just now getting the preliminary results from the 2016 mapping. Here is the first satellite image:
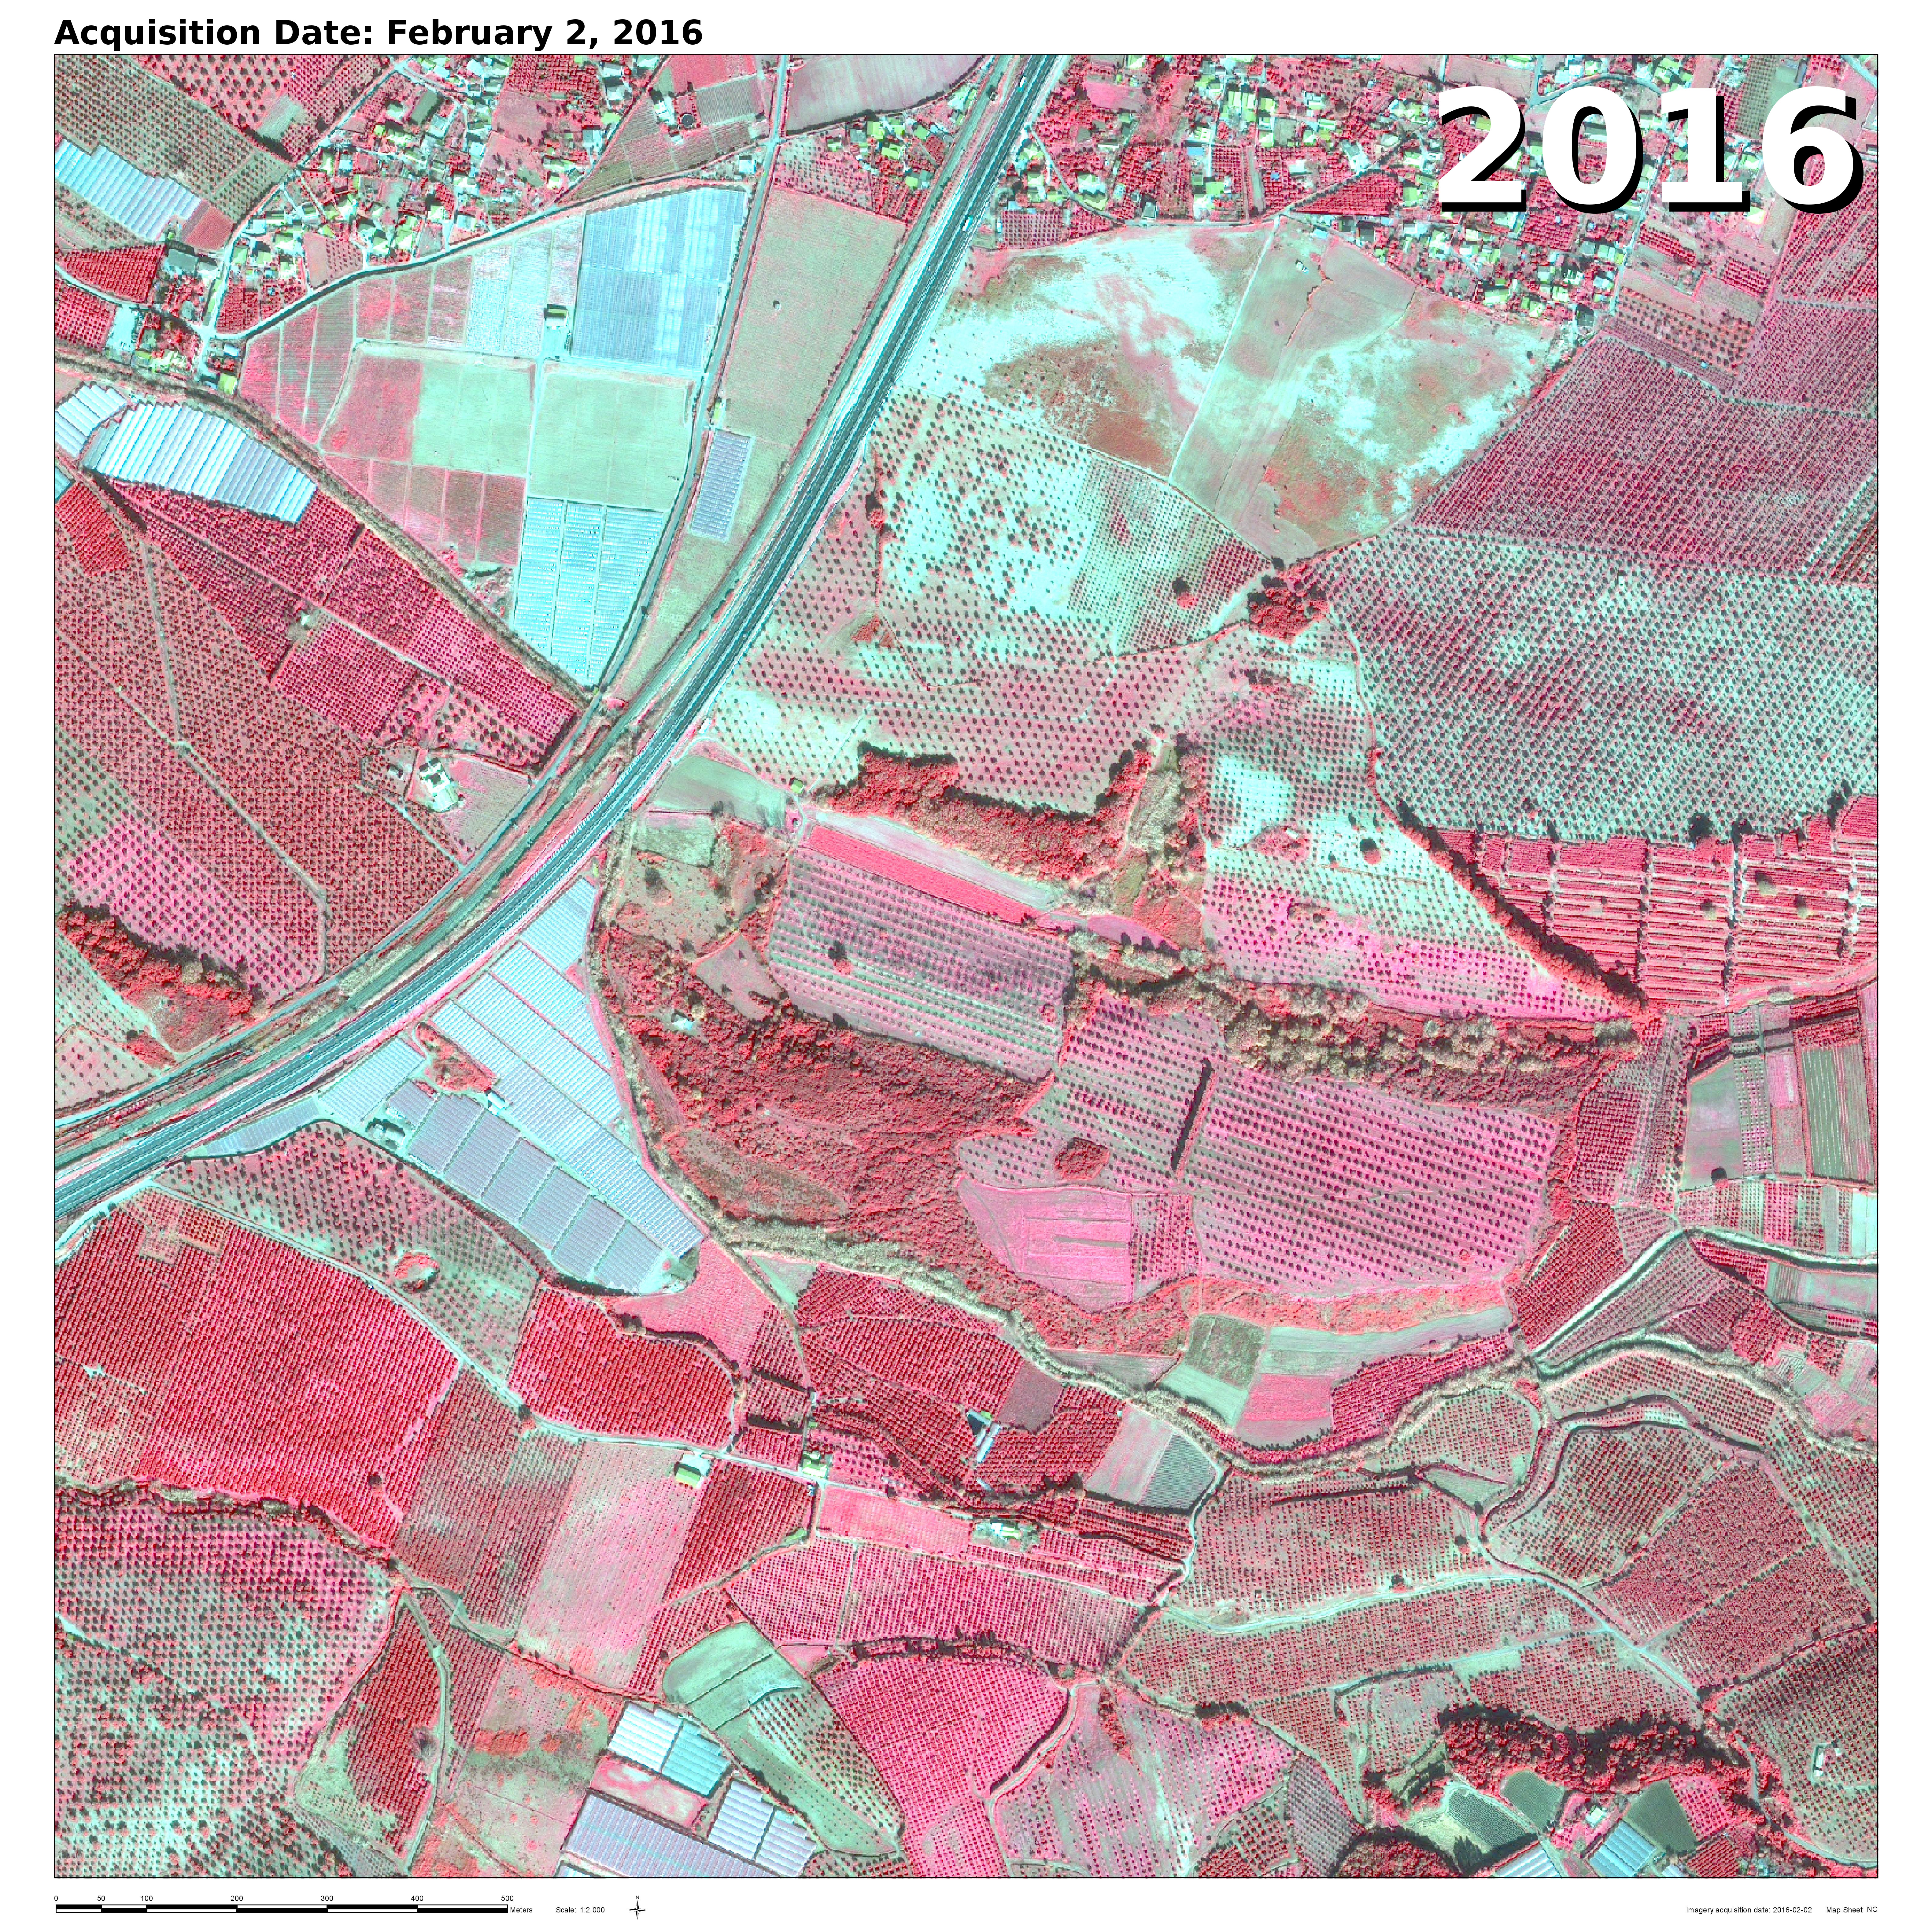
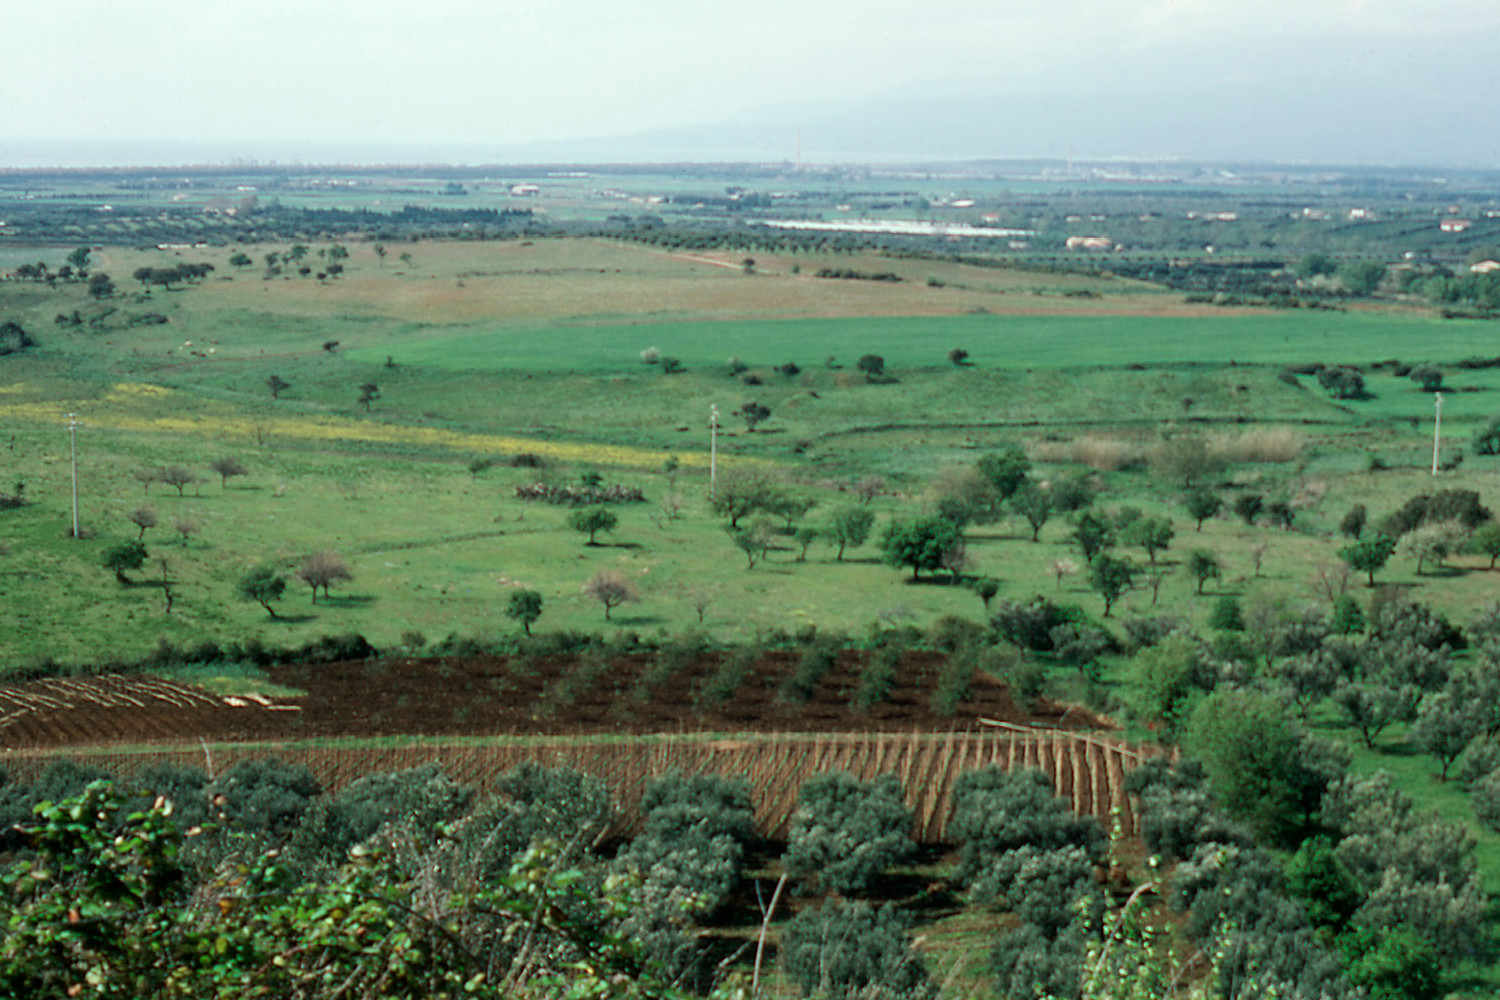
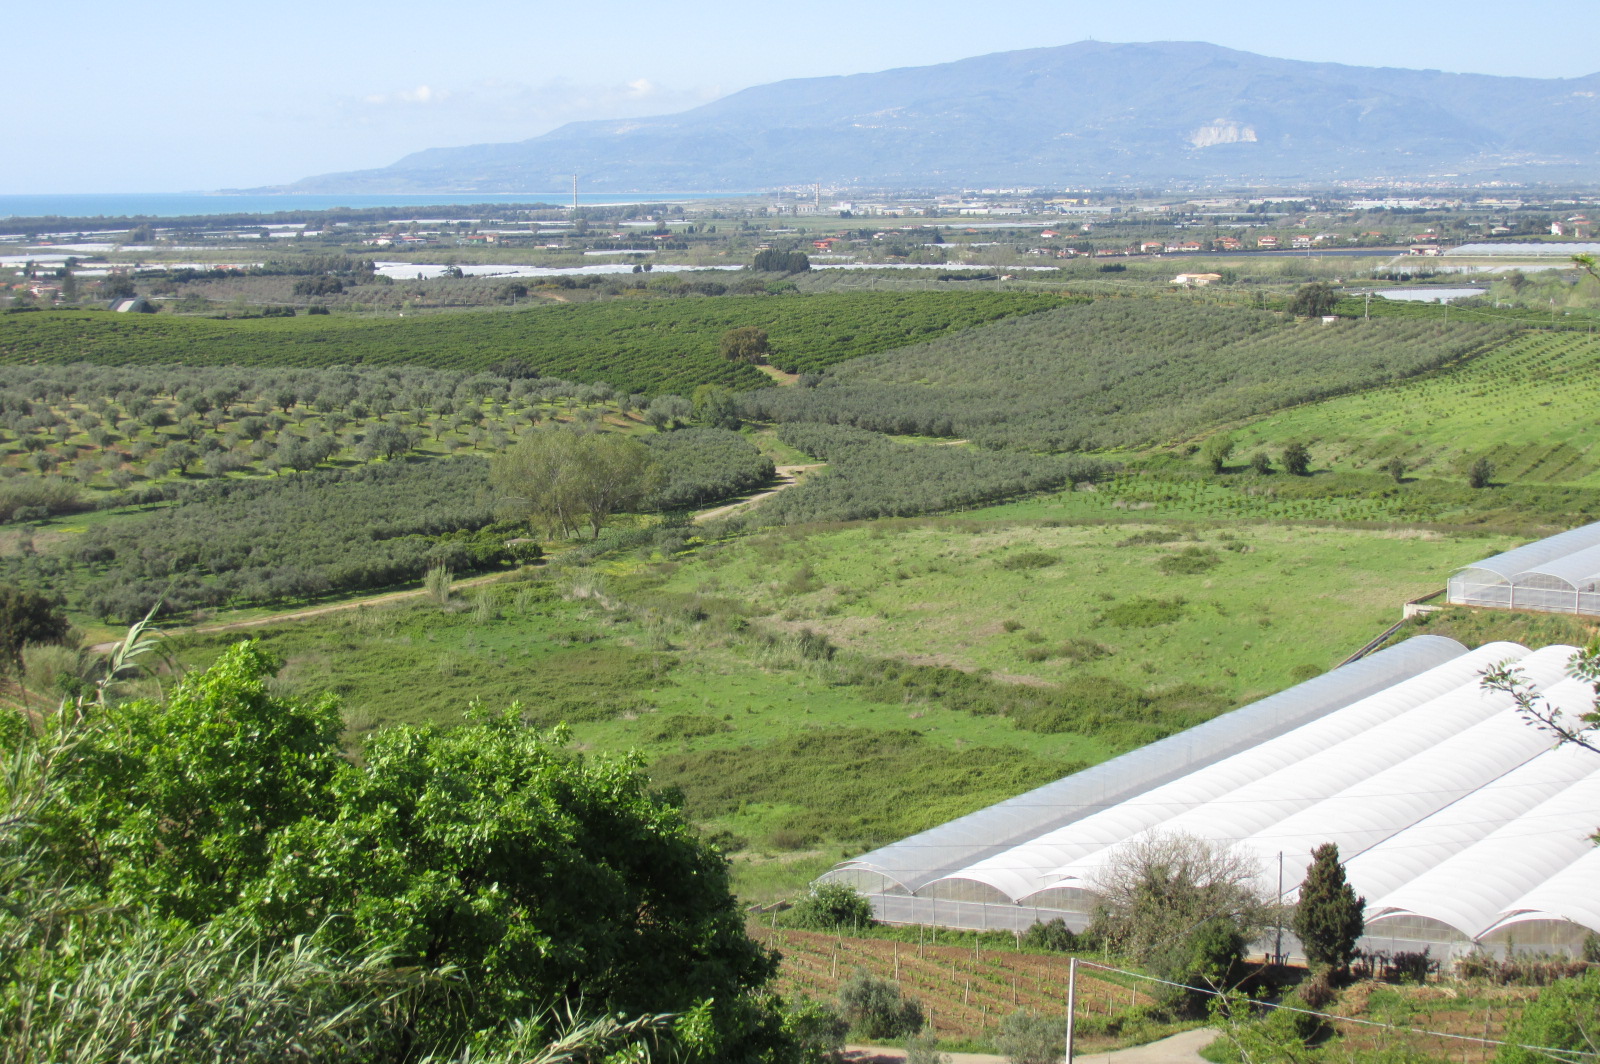
We have also received our photograph of Piana Di Curina site for 2016 (below right), which we have for every survey year since 1980 (below left). Over 36 years, we see the transformations in the maps of Acconia’s landscape—a move toward more productive land use as exemplified with the intensification that accompanies the proud greenhouses.